Now that your destination management platform is up and running, what’s next? How can you use tourism data to maximise your destination’s success?
What can you do with tourism data?
Big data is now a must for all destination managers.
But having access alone isn’t enough.
How can all this data be effectively translated into actionable steps?
The opportunities are endless: every bit of data can lead to actions that help your destination grow, perform better, and beat competitors.
Using our destination management platform Data Appeal Mabrian, let’s look at some basic and important ways to use data to improve your tourist destination’s success.

1 – Help operators boost their reputation and improve the destination’s overall image
CHALLENGE
For tourism destinations, teamwork truly makes the dream work.
After all, the reputation of a destination is the result of the combined efforts and performance of businesses.
Ranging from hotels and restaurants to cafes, museums, parks, and shops, the performance of each individual business ultimately moulds the reputation of a city or country.
The question is, how can you help your operators and business owners improve their reputation, including their online presence, through the help of tourism data?
SOLUTION
Analyse each individual sector of your destination (hotels, restaurants, attractions, etc.), identify strengths and weaknesses and share the results with operators and all stakeholders.
The following is a sample of semantic analysis focusing on the hospitality sector of a particular city.
You’ll notice that certain areas of the facilities — such as costs and rooms — receive a lower Sentiment Score. This indicates that these aspects are met with less favourable opinions, often expressed negatively online, consequently impacting the destination’s reputation adversely and calling for improvements.
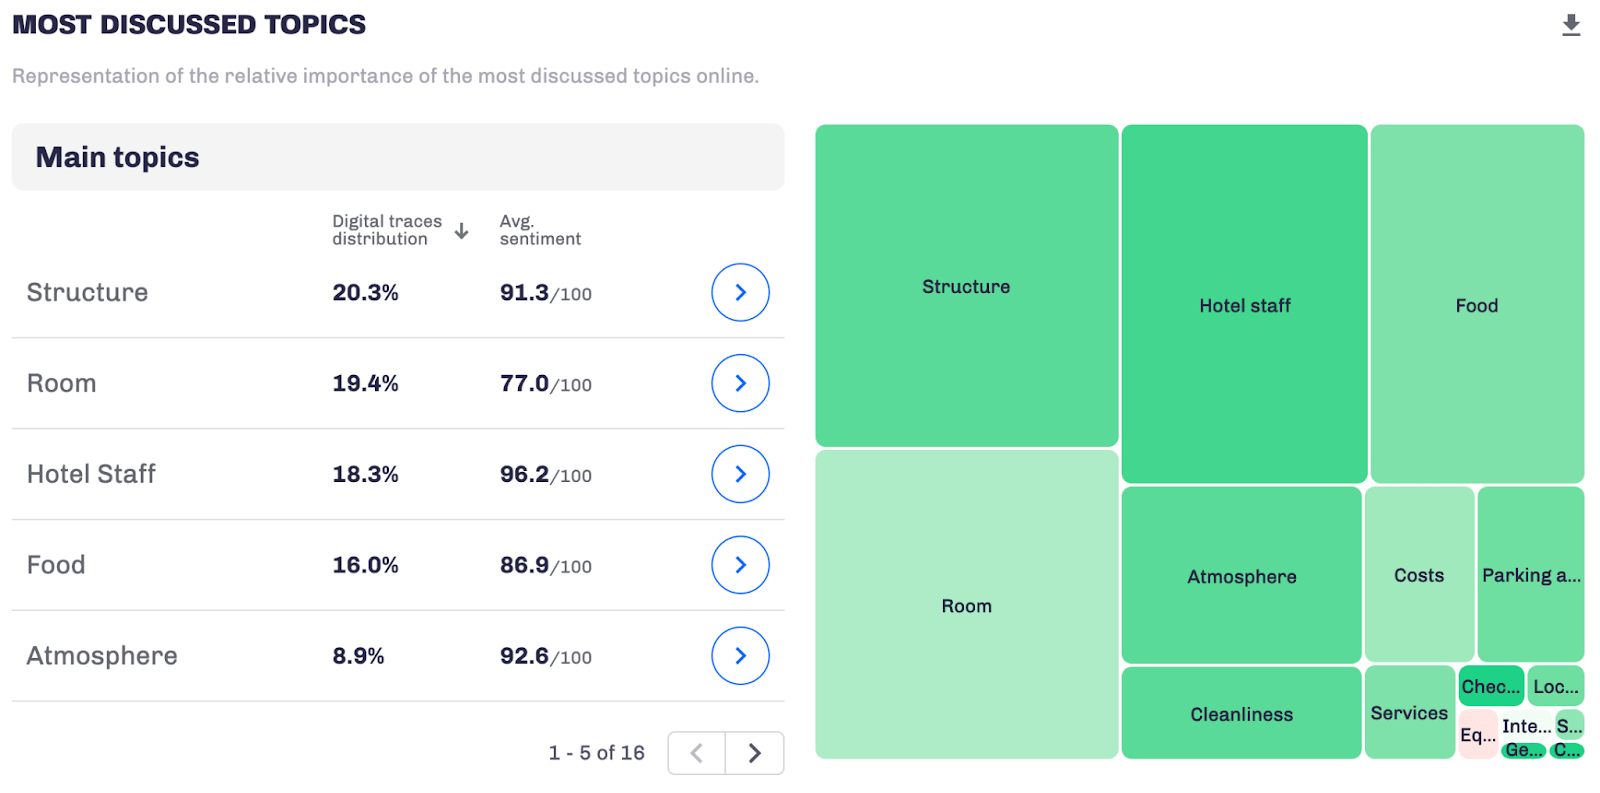
(Semantic analysis hospitality sector – source: Data Appeal Mabrian)
Another point for discussion with operators is how people use digital platforms.
Where do they typically leave feedback? What platforms do they use to plan their trips? Which channels should operators focus on monitoring and improving to attract attention?
(Source: Data Appeal Mabrian)
Gather this information and arrange a meeting with hotel owners, either through a webinar or a training session. Share this data with them so they can reconsider their pricing, invest in room upgrades, and enhance their services.
A similar approach can be taken with venue and restaurant managers, as well as those involved in museums and tourist attractions.

2 – Improve visitors’ experience at your destination by making the right investments in services and infrastructure
CHALLENGE
What a destination provides in terms of public transportation, information centres, city passes, and other services significantly impacts the visitor experience.
How do you pinpoint when and where to step in to fix problems and make travellers’ experiences better?
SOLUTION
Once again, review sentiment data and online content semantics for each sector to gauge people’s perceptions and pinpoint critical destination issues that require intervention.
What are people complaining about?
Is it shortage of parking, steep museum fees, or a weak public Wi-Fi signal?
Being aware of your areas of weakness means you can identify the necessary collaborators to address and resolve these issues, as well as determine the actions needed to enhance the visitor experience.
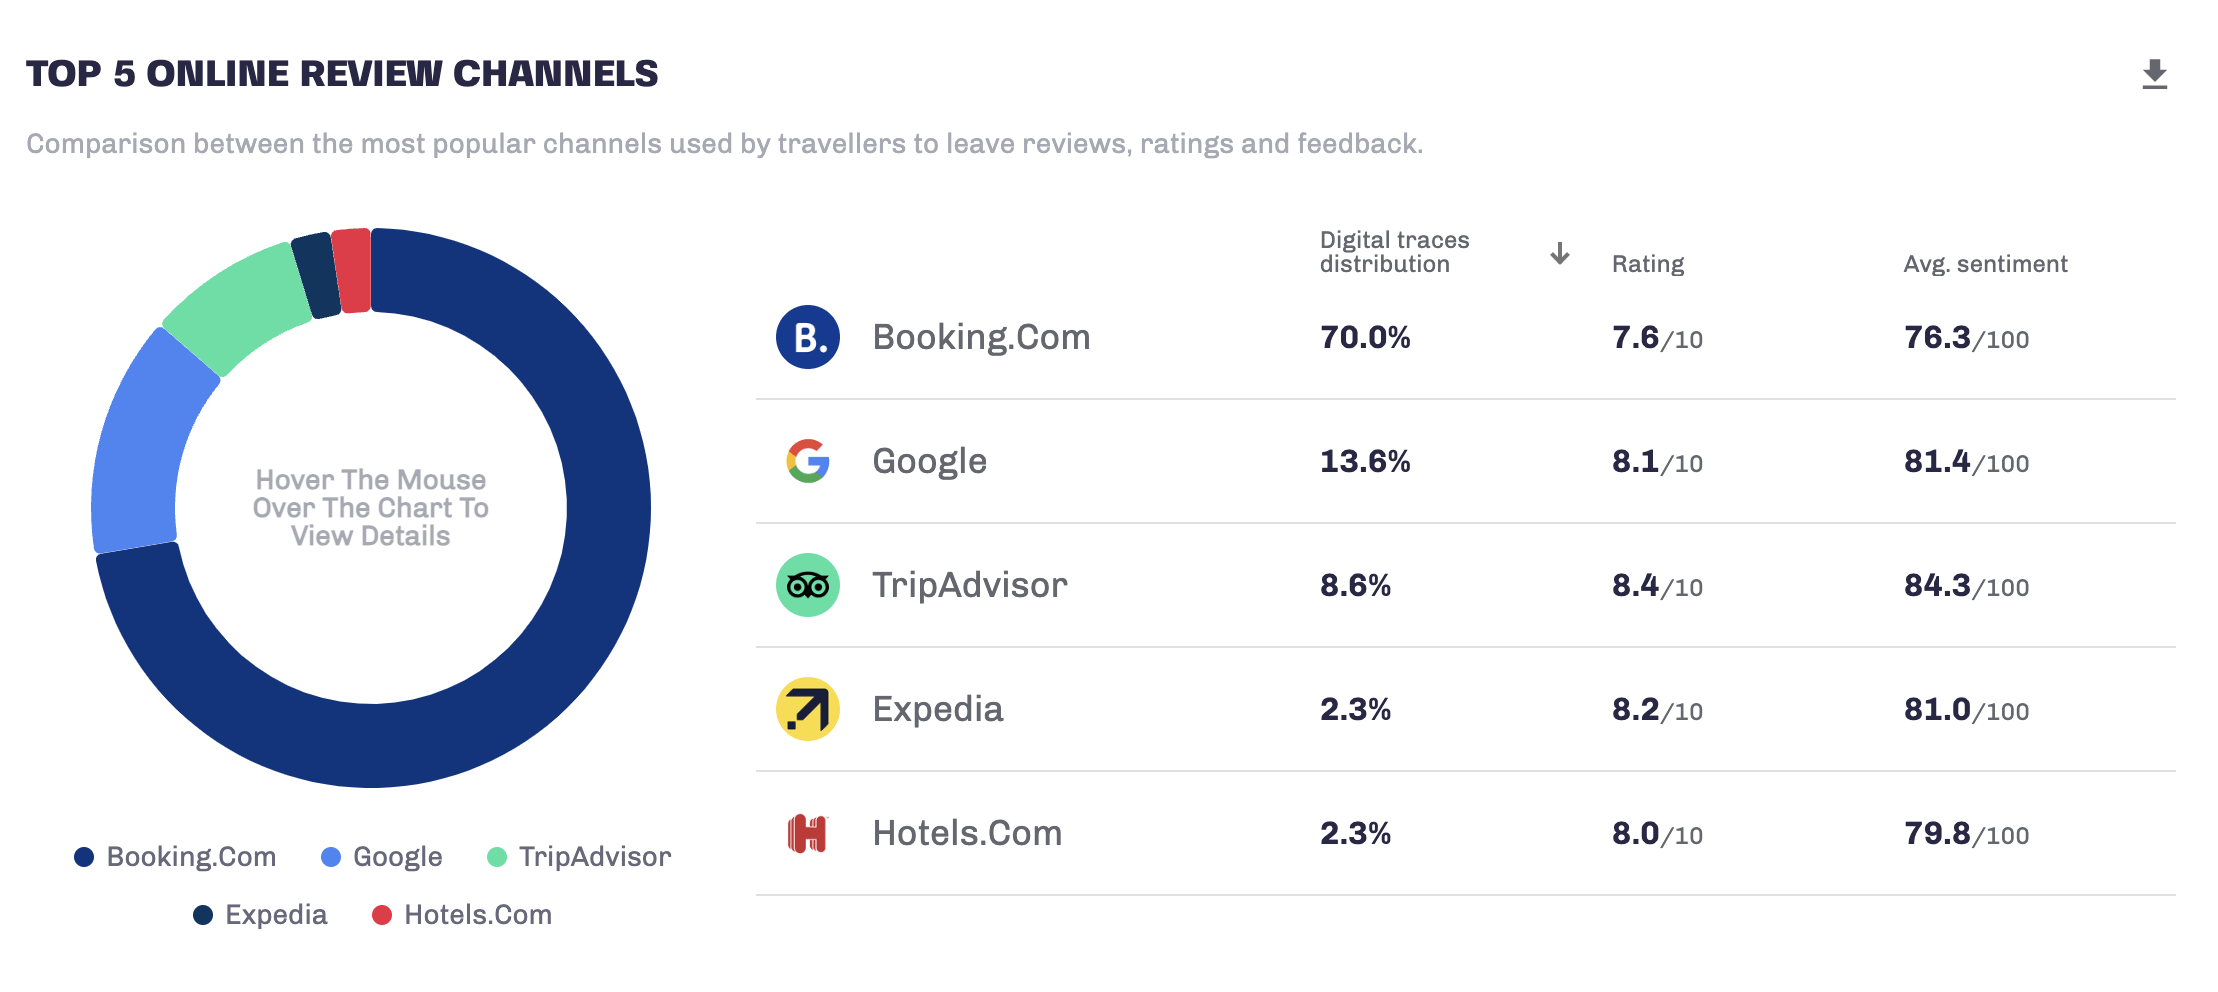
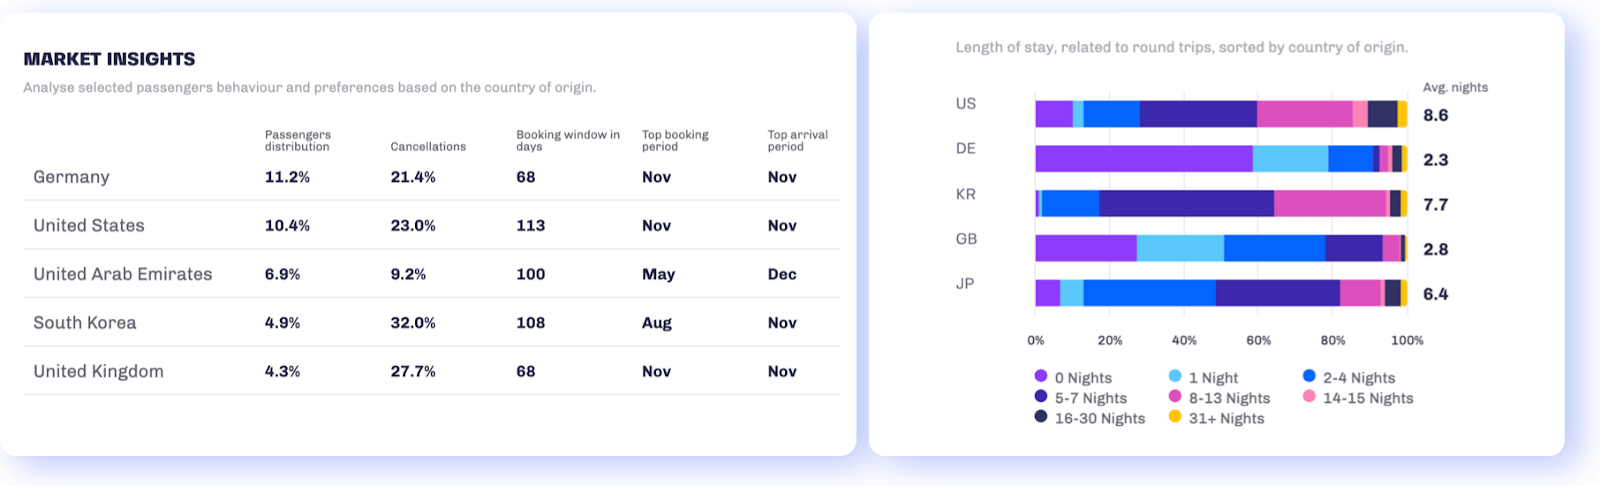
The following is the semantic analysis of recent content for a renowned Italian art city, revealing that accessibility emerges as the topic with the least favourable Sentiment Score, standing at 74 out of 100.
This provides the city with a chance to reassess accessibility to its cultural sites, striving for greater inclusivity for everyone.
(Analysis of the most discussed topics – source: Data Appeal Mabrian)
3 – Understand your visitors to make your marketing campaigns more effective
CHALLENGE
Destination marketing campaigns are neither easy to plan nor to measure.
How can I be certain that my investments are yielding the best returns? That I’ve accurately identified and reached the intended audience? That my campaigns are strategically rolled out in the most promising countries?
SOLUTION
Information regarding hotels, pricing, airline flights, and sentiment analysis is extremely valuable for enhancing tourist profiling at your destination and determining the most effective allocation of your promotional budget.
Analyse this tourism data to gain deeper insights into your target visitors and their preferences:
- Where are your international visitors flying in from?
- In what language do they typically write their reviews?
- What are the preferred aspects of their stay?
- Which class of flights do they usually book: economy, business, or first class?
- How many days in advance do they typically make their bookings based on their country of origin?
- What is their budget for accommodation?
- How long is their typical duration of stay?
This, along with more information, can help you develop more precise profiles of the individuals you intend to target.
For instance, if sentiment analysis indicates that particular museums, beaches, or clubs are highly appealing aspects of your destination, why not focus your social media marketing campaigns or YouTube videos on those places?
On the other hand, directing resources towards aspects of the destination that receive significant criticism from tourists could potentially attract a segment of visitors who may end up disappointed with their experience.
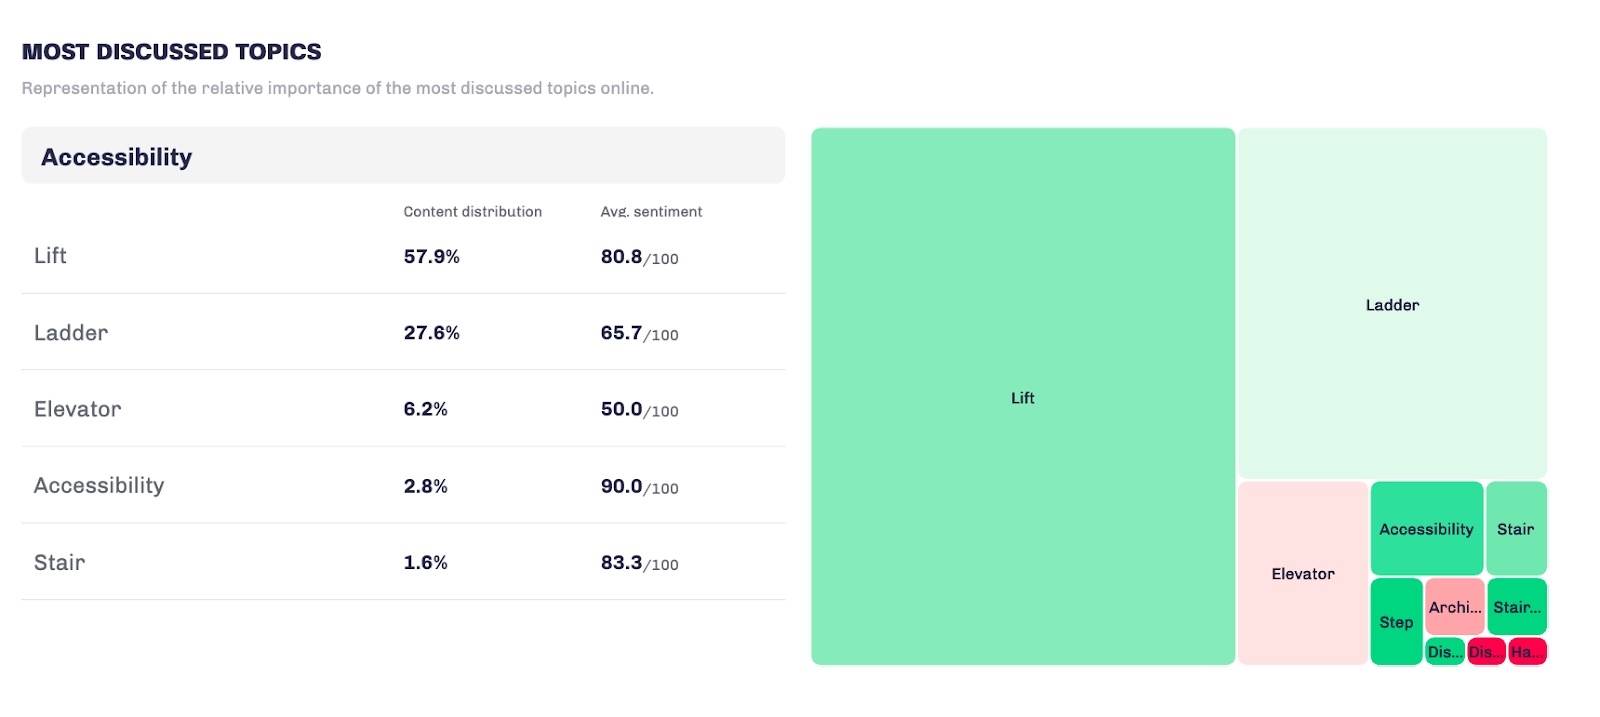
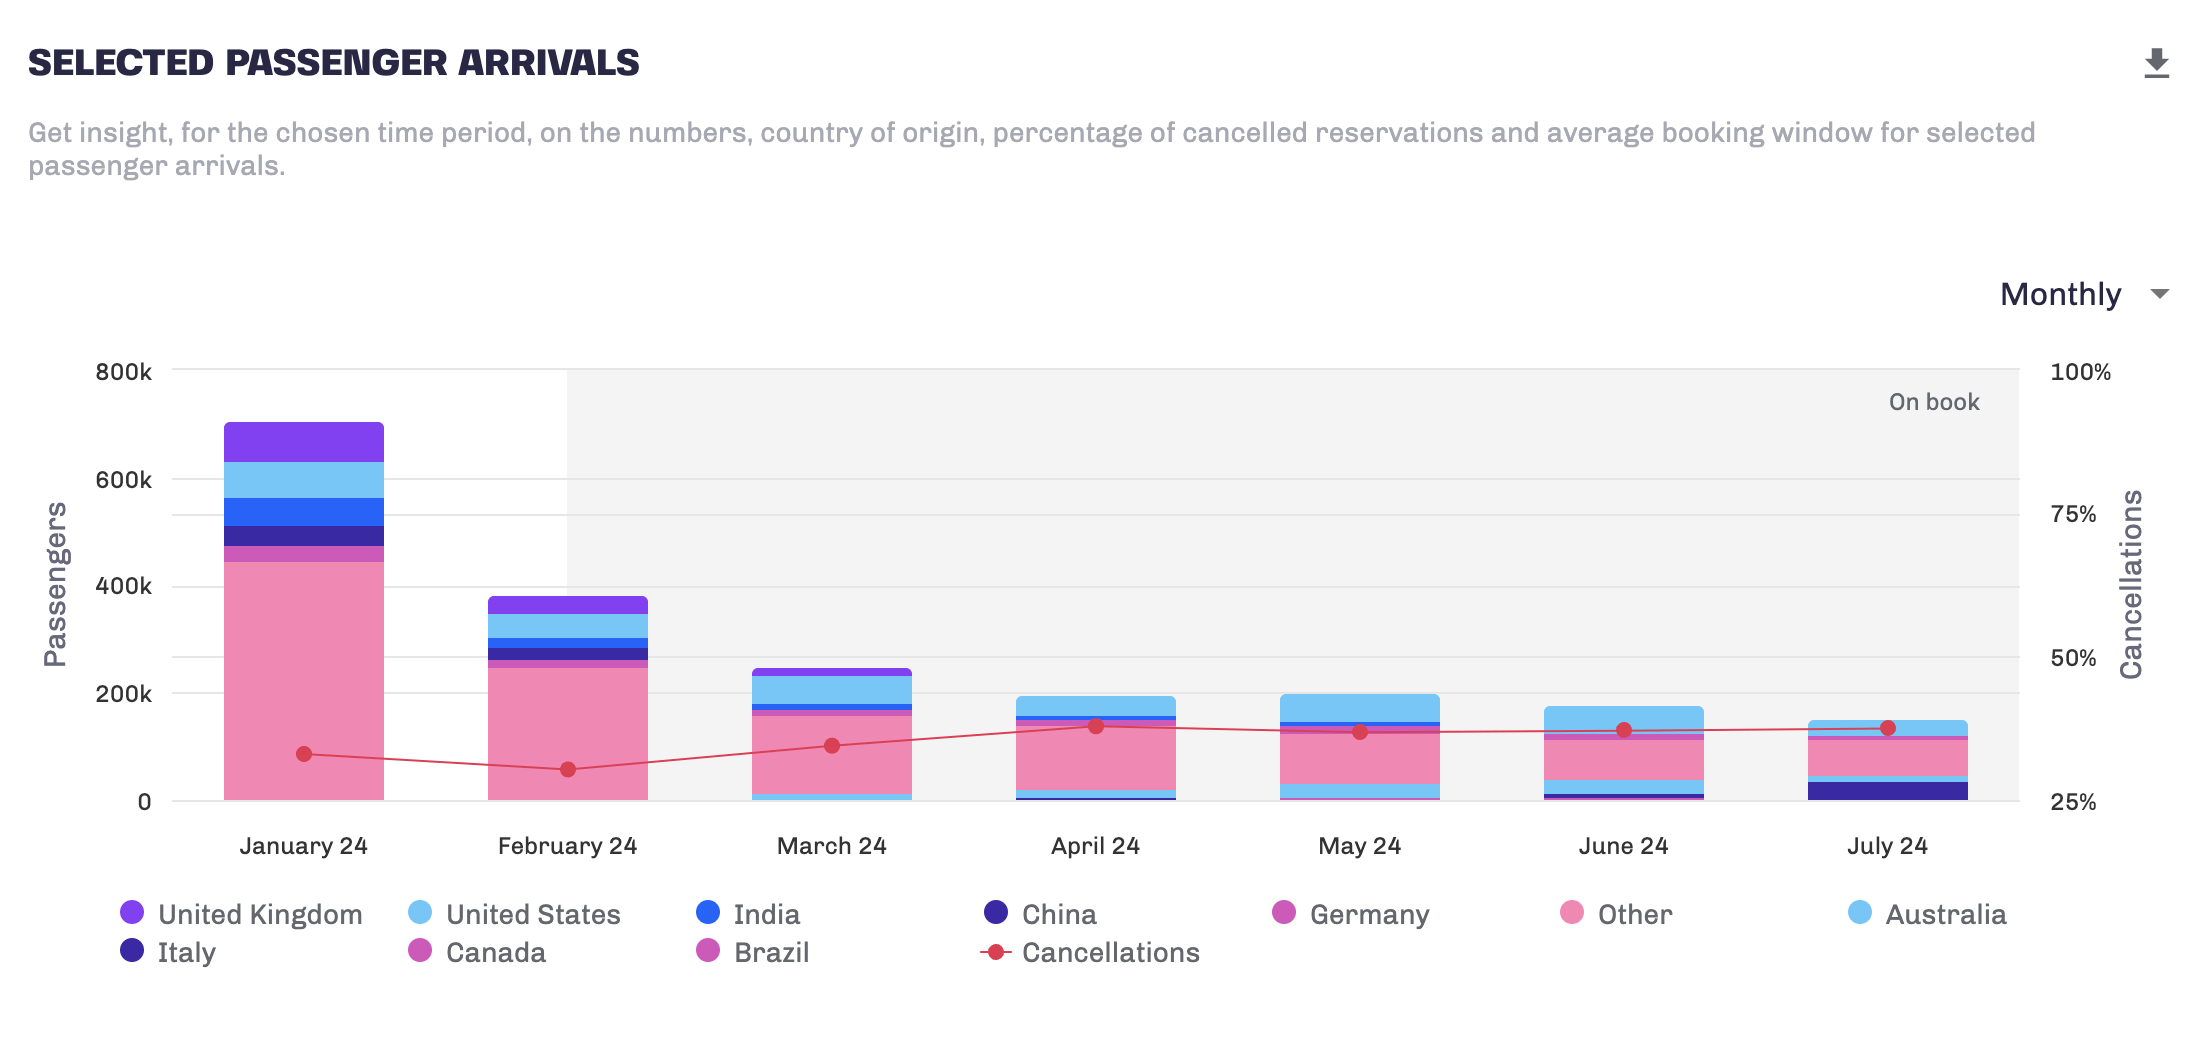
Here, for example, we see a destination that has tourists coming mainly from Germany, the US and the United Arab Emirates. US travellers book at least three months in advance and stay an average of one week.
So, to effectively target North American audiences with marketing campaigns, you’ll need to plan well ahead and offer extended travel options. For instance, on the destination’s official blog, consider creating content like “Exploring Berlin: A 10-Day Itinerary” or “Planning Your Skiing Adventure in Cortina: Step-by-Step Guide”.
For Germans, however, who typically have an average stay of two days, you can suggest numerous weekend getaway ideas.
(Analysis of the departure locations of air travellers – source: D/AI Destinations)
4 – Evaluate the effects of significant events to fine-tune service organisation
CHALLENGE
Major events can either be a boon or bane for a tourist destination.
While they serve as a significant draw and positively impact the local economy, major events can also pose challenges for residents and the surrounding environmental ecosystem.
So, how can you guarantee ideal experiences for both tourists and residents, even during major events?
SOLUTION
Information regarding events and anticipated crowds is highly valuable for predicting flows and implementing optimal organisational strategies.
Monitor the rise in demand, saturation of hotels and short-term rentals, peak attendance days, and the geographic distribution of events to efficiently manage your destination and cater to tourists.
With a granular analysis of events, you can answer several questions such as:
- Are there specific zones with a higher concentration of events requiring increased attention to manage crowd flow effectively?
- Can the services provided in these areas be better?
- How can the signage directing attendees to the venue be improved?
- If the event location is within a restricted traffic zone, can I streamline transportation by offering shuttle buses or trains from nearby locations?
- Are there an adequate number of information points available?
- What measures can be taken to safeguard sensitive natural environments?
- How can communication with residents be improved to minimise inconvenience during events?
For example, the following analysis looks at where events are happening in an area and how many people are expected to attend each day.
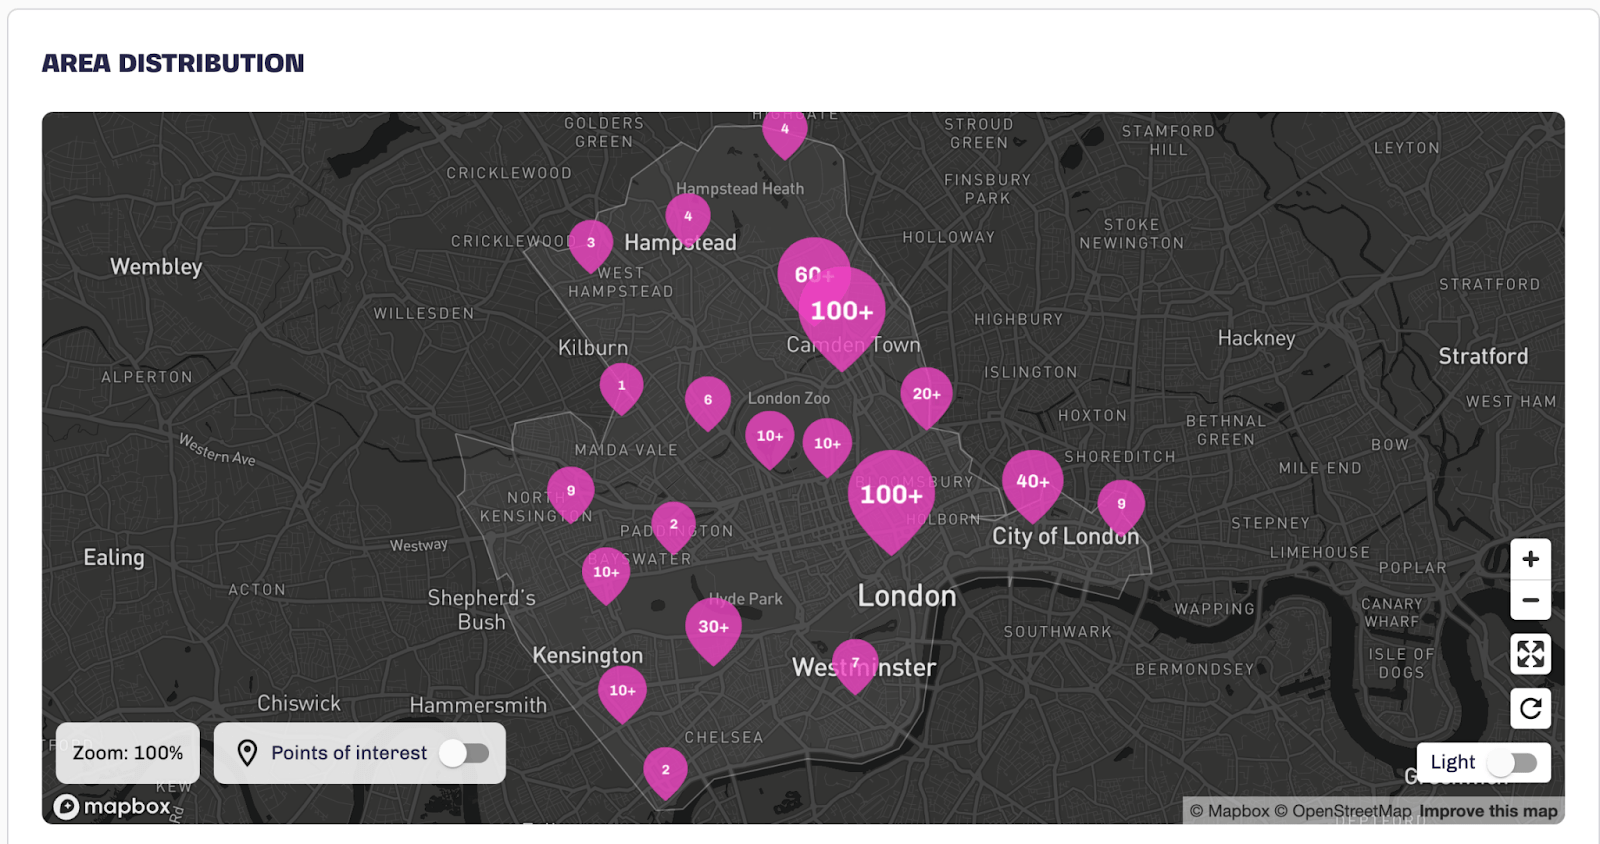
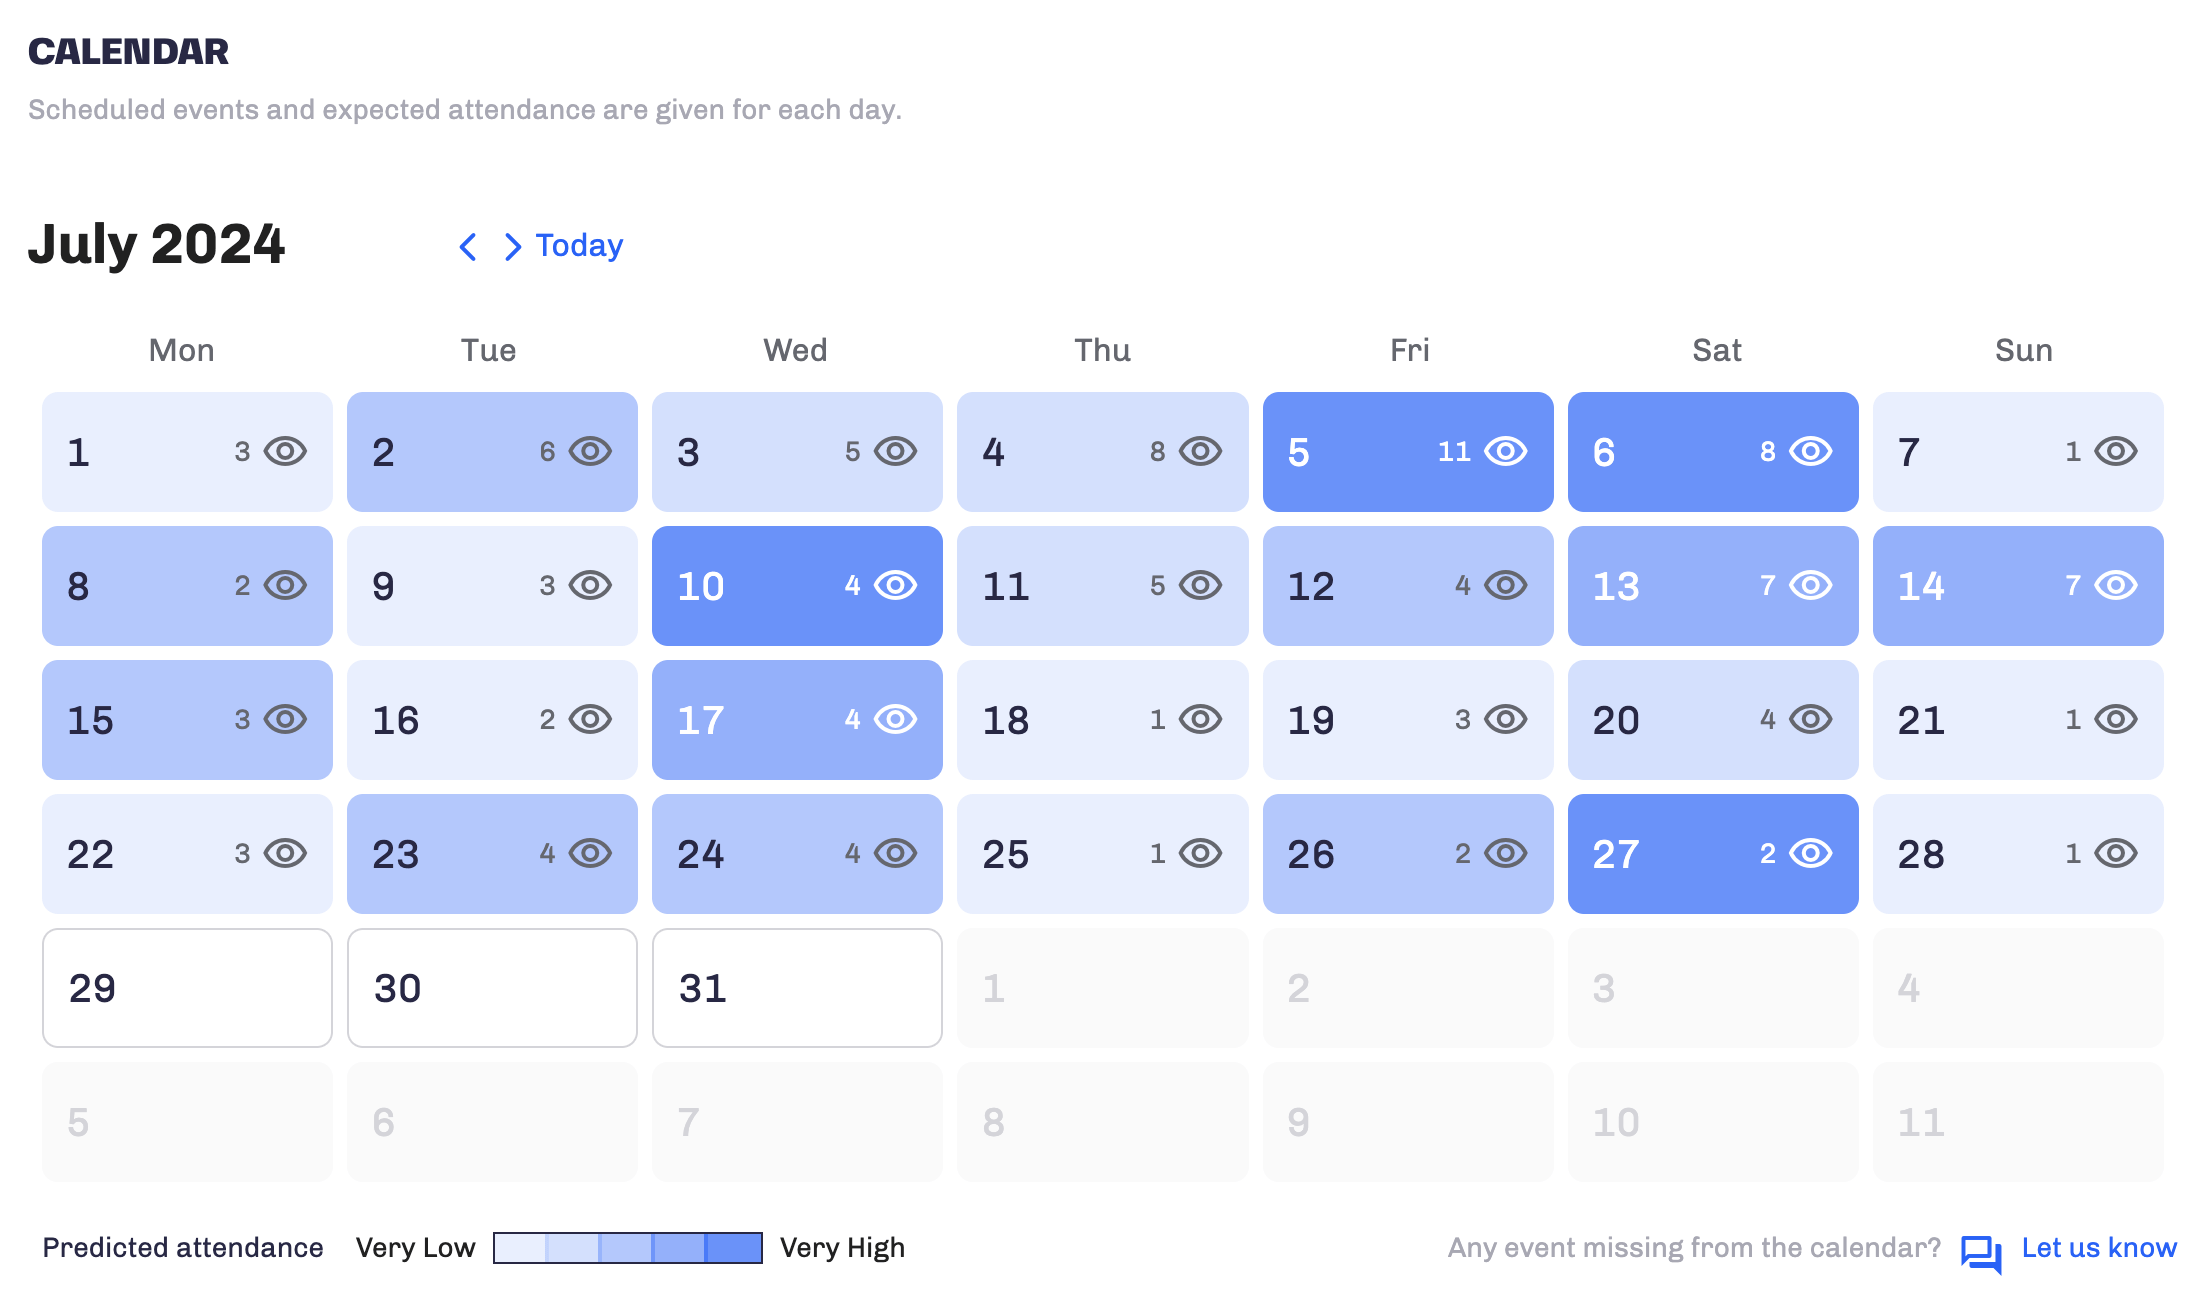
(Event distribution on map and events calendar – source: D/AI Destinations)
5 – Compare your destination’s offerings with those of competitors
CHALLENGE
In today’s competitive tourism landscape, every destination, regardless of size, needs to allocate time and resources to enhance its visibility and competitiveness.
Through these thorough comparisons with destinations that share similar offerings and geographical characteristics, you can capture new market shares and boost tourist arrivals and satisfaction.
How can you quickly and reliably conduct a benchmarking analysis?
SOLUTION
Platforms like Data Appeal Mabrian enable you to easily compare your destination with others with just a click.
On our platform, you can simply use the ‘COMPARE‘ function to juxtapose one city or country against another, simplifying the comparison of two destinations.
For instance, Piedmont assesses the performance of the Langhe Monferrato Roero area by comparing it to others with a similar purpose, such as Burgundy and Chianti.
Here, we observe a comparative analysis with Burgundy. Through the ‘COMPARE’ function (located at the top right), the destination can be evaluated across various aspects including general sentiment, sector-specific sentiment, OTA saturation and hotel rates, air arrivals of visitors, and more.
Rapidly comparing with competitors provides insights into your market positioning and helps identify weaknesses, enabling more effective investment strategies.
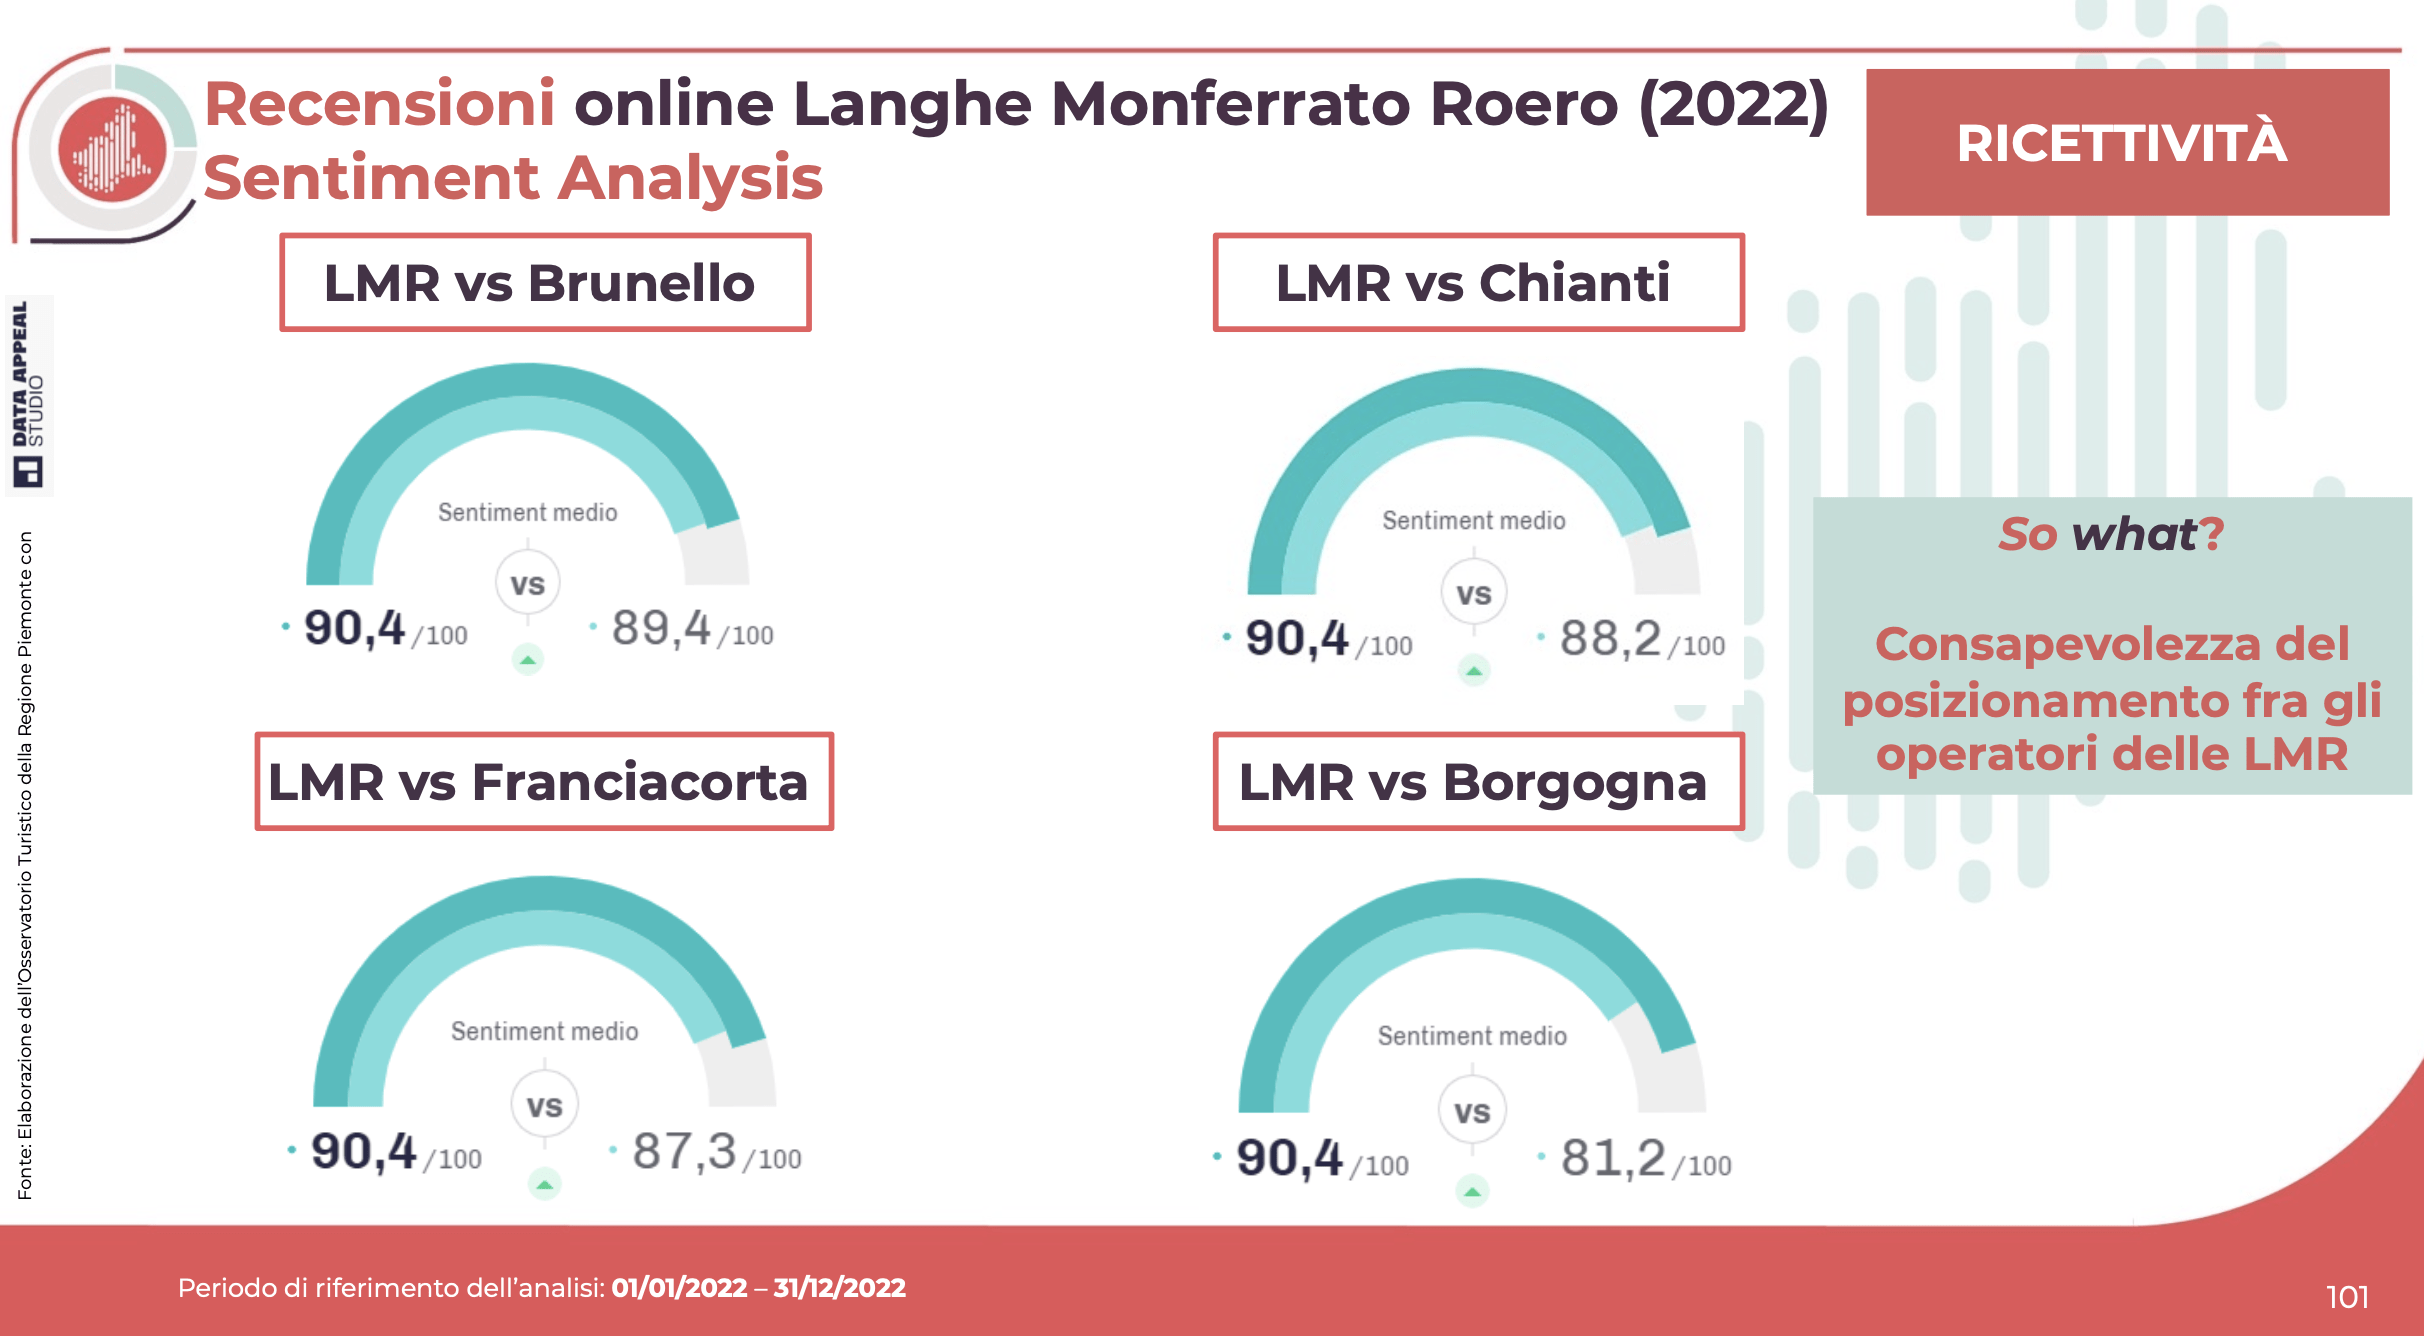
(Comparative data presented by Visit Piemonte in 2023 – source: D / AI Destinations)
6 – Compare the results of the present year with those from previous years
CHALLENGE
“How was the season?” is a frequently asked question in the tourism industry. Stakeholders and partners are keen to understand the season’s performance in terms of attendance, bookings, hotel revenue, sentiment, and more.
Again, making a direct comparison isn’t as straightforward as it seems.
SOLUTION
With a destination management platform, select your desired tourism data and conduct an automatic comparative analysis once it’s consolidated and fully updated, to assess any changes from the previous year or season.
Recently, our team used Data Appeal Mabrian to analyse how the summer season in Italy compared to last year’s.
We compared:
- Hotel and non-hotel rates
- Offers put up for sale on OTAs
- OTA saturation level
The data indicates that summer tourism in 2023 showed positive performance overall, although it fell slightly short of the outstanding results seen during the same period in the previous year.
While the data for June and July closely resembled those of 2022, there was a noticeable decline in OTA bookings and a rise in unsold bookings towards the end of the month and into August.
The decrease in the digital presence of Italians, a reliable reflection of market trends, indicates a tangible drop in the number of Italian visitors.
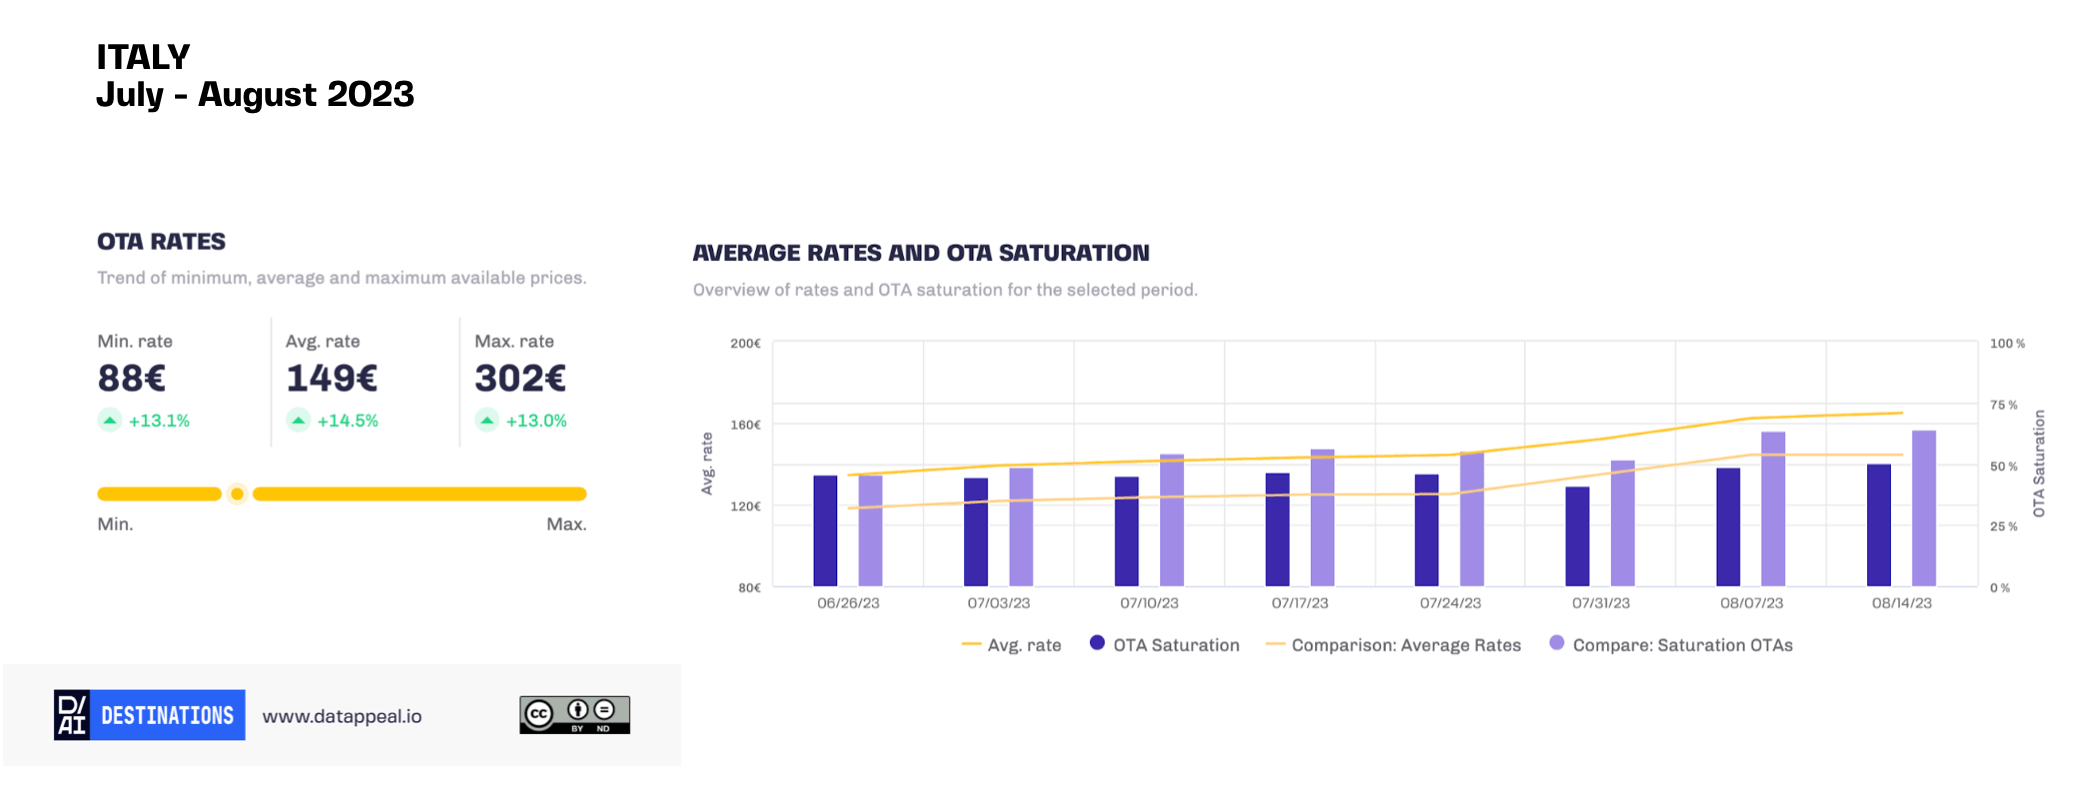
(Analysis of hotel rates and OTA saturation – source: D / AI Destinations)
7 – Anticipate your destination’s tourist flows
CHALLENGE
Anticipating the number of visitors to your area or country in advance is crucial.
You can predict peak periods in advance and arrange services to mitigate inconvenience for both tourists and locals.
Alternatively, you can pinpoint the busiest periods for your operators and implement marketing initiatives to attract additional tourists and enhance occupancy rates.
However, acquiring this information can be complex, as often only tourism offices have the capability to detect it.
Regarding hotel occupancy, each establishment utilises its own booking system. Only if each individual establishment shares this data on a daily basis would the destination have comprehensive information.
How can we forecast trends in tourist flows using current and trustworthy tourism data?
SOLUTION
Use data on OTAs and flight arrivals.
Gather real-time sales trends from prominent portals to gauge anticipated arrivals. Additionally, analyse trends in airline bookings to assess whether arrivals are on the rise or decline, and by how much.
By merging this tourism data, you can create accurate projections regarding tourism flows.
Consider D / AI Destinations: within the ‘OTA Focus‘ section, you’ll discover an examination of OTAs (like Booking) as well as rates for hotels and short breaks.
In the “Flights” section, you’ll find bookings for the upcoming 12 months, along with arrival statistics and cancellation rates. The latter data is sourced from Travelport, one of the primary international GDSs.
(Analysis of incoming visitors for the upcoming months – Source: D / AI Destinations)
8 – Manage overtourism
CHALLENGE
Overtourism poses a significant challenge for numerous tourist destinations.
Predicting arrivals and safeguarding the social and cultural integrity of the destination is indeed one of the paramount challenges of our era.
SOLUTION
Data can serve as the antidote for overtourism.
Many destinations have used and continue to data in this way.
Venice, widely known as a prime example of a destination grappling with overtourism, has taken numerous measures in recent years to address this issue by leveraging data.
To handle the challenging circumstances during Carnival, for instance, in 2020, the authorities implemented a system of cameras and sensors to proactively manage crowds and monitor movements within the area and the city.
Starting from 2022, on the other hand, by analysing tourism data, the city plans to organise a more expansive Carnival with events also held in peripheral areas to alleviate congestion in the city centre.
Other destinations utilise data to analyse each specific area within the destination.
Are there regions with positive sentiment and notable attractions that can be promoted to redirect tourists’ focus toward less crowded areas?
On the other hand, are there areas with a high density of attractions but low sentiment, where intervention is needed to prevent overcrowding?
Below, you’ll find an interactive map from D / AI Destinations, providing a quick overview of where attractions are clustered and the perception of each area.
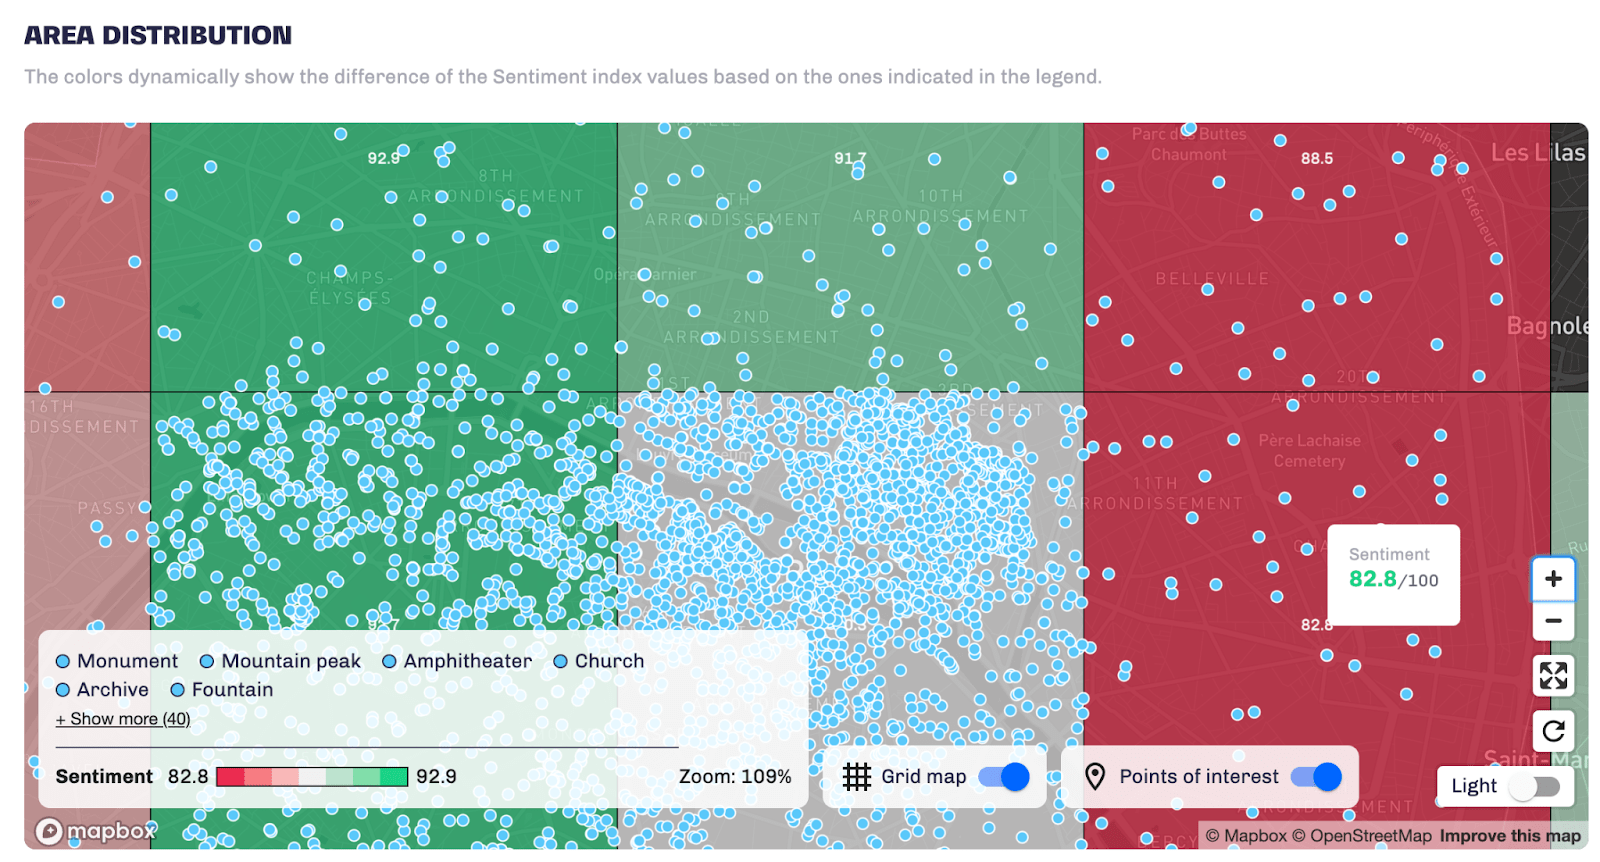
(Map of the distribution of attractions across the territory and related sentiment – source: D / AI Destinations)

9 – Identify growth opportunities through social media
CHALLENGE
Instagram, Facebook, and other social media platforms are effective tools for increasing visibility. However, how do they monitor a destination’s engagement?
And how can you use them to find and seize new opportunities? Identify influencers to reach out to? Find the trending hashtags?
SOLUTION
There are specific tools for social analysis. These comprehensive platforms enable users to track the level of conversation about a brand or place, identify the most engaging content, and discover potential brand ambassadors who promote the destination.
Data Appeal Mabrian also features a “Media Monitoring” section, which displays the number and sources of leads generated online for your destination across connected channels, along with the sentiment expressed and the level of engagement.
Within minutes, this data analysis can provide crucial insights to help you plan your social media actions effectively:
- Which channels are the most effective?
- Which channels generate the highest volume of content and engagement?
- What types of content yield the best results?
- What topics are the most captivating to audiences?
- Which hashtags are the most utilised and impactful?
- Who are the individuals reaching the widest audience when discussing your destination?
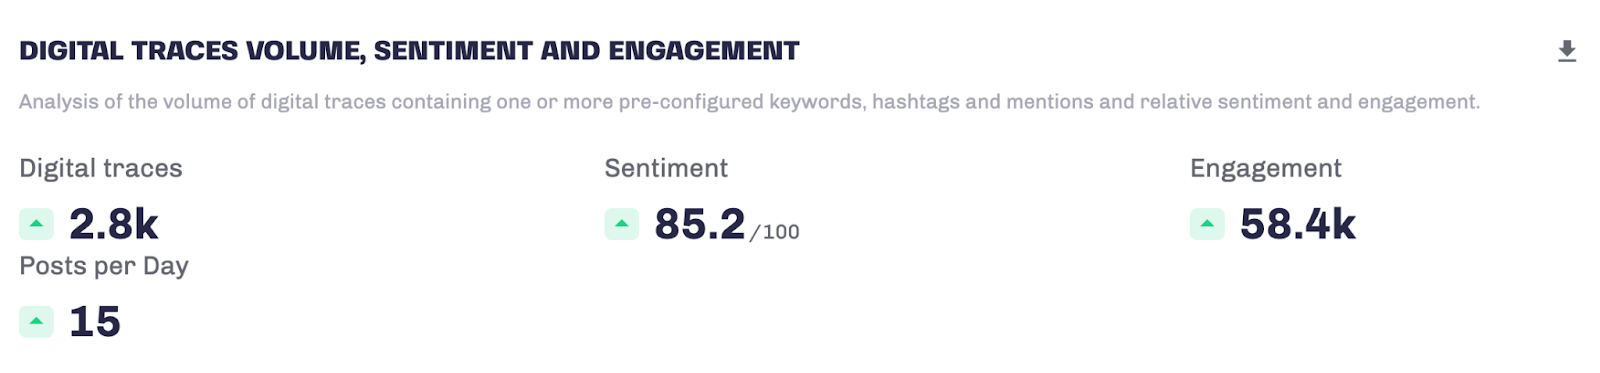
(Media Monitoring Section – D/AI Destinations)
10 – Generate automatic tourism reports for distribution to the media
CHALLENGE
Television, magazines, and newspapers frequently seek to cover your destination on an international scale.
Plus, showcasing tourism advancements in the media is an effective means for political representatives to showcase investments to the public, while also involving new partners and stakeholders.
Therefore, securing current, up-to-date, and comprehensive information on tourism trends to share can often be challenging for a tourist destination.
SOLUTION
Utilising a tool that automatically gathers, organises, and analyses data is an excellent method to ensure access to all the essential information for sharing.
For instance, with D/AI Destinations, one can easily navigate to the ‘Reports‘ section, choose the desired analysis period, and generate a PDF document for sharing or printing. This convenient feature ensures that the data is readily available for distribution to the press or publication on your own media channels.
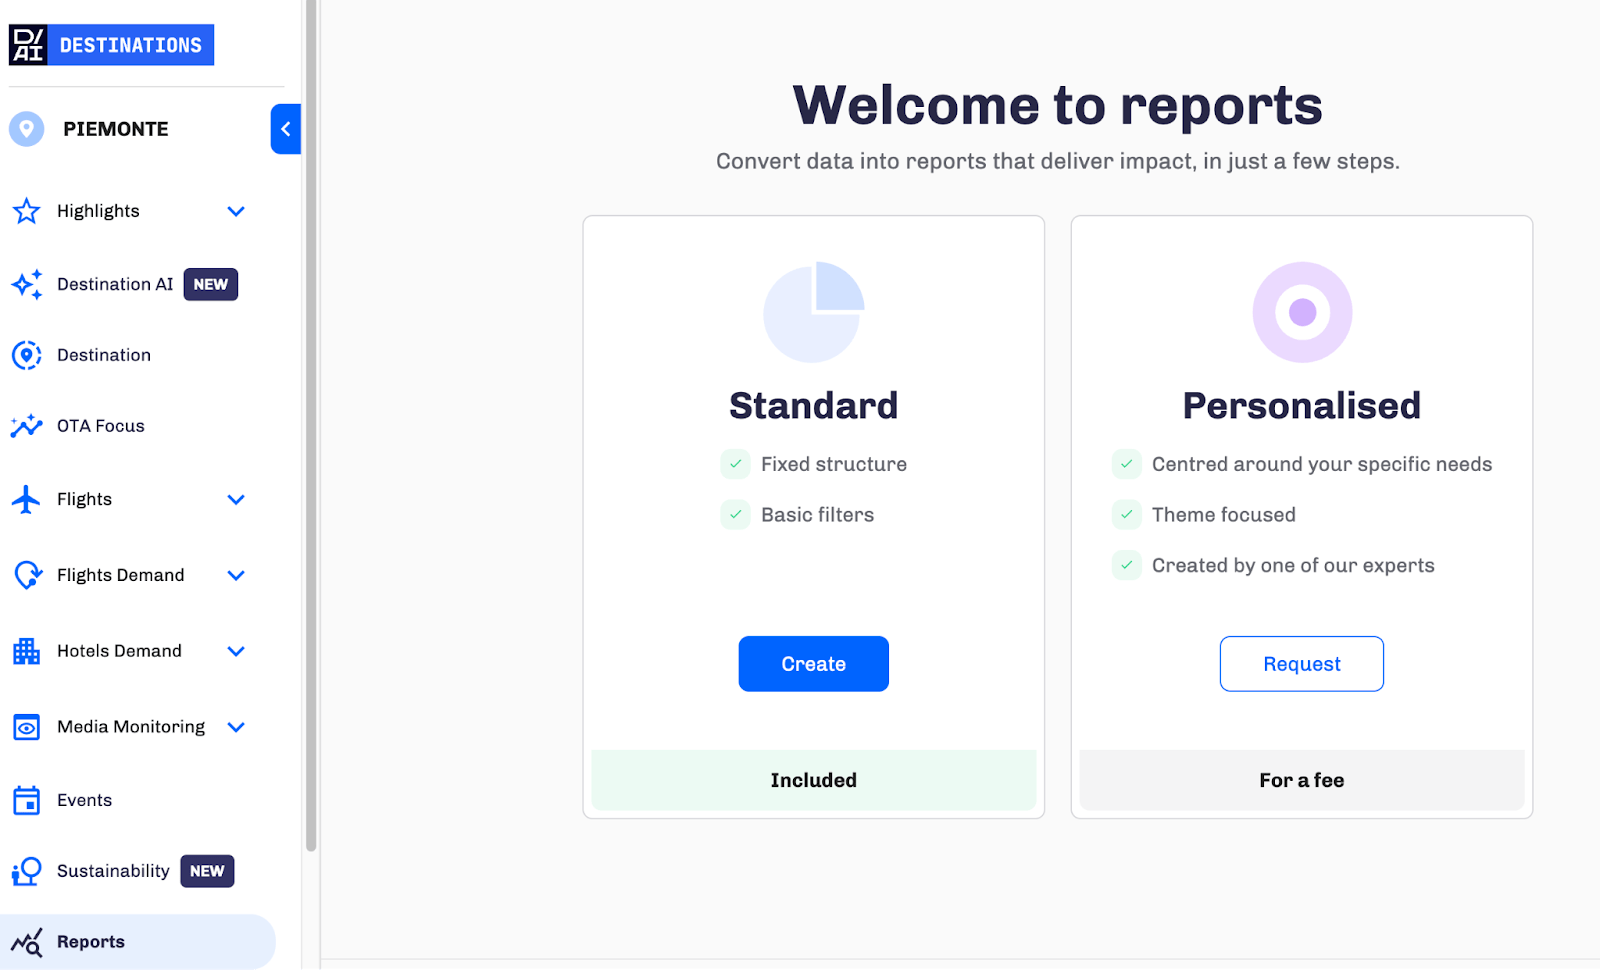
(Reports Section – Data Appeal Mabrian)