Data-driven Insights Reveal
what the Eyes Can’t See
Back in April, we leveraged Data Appeal Studio, the first, all-inclusive Location Intelligence, Experience Intelligence and Destination analysis platform, to forecast the summer season in Italy. As evidenced in the screenshot below, we’ve detected the aggregate trends of online content (social posts, reviews, etc.) which is a parameter that we use as a proxy to accurately predict the trend of tourism flows.
After many studies, we’ve identified an evident correlation between the number of reviews from human experience and official destination data. Our correlation algorithm between online content and official visitor data is very strong and accurately reports visitor flows and their origins.
However, for the entire period analyzed, April 1st to September 30th, there was a decrease in online content of nearly 66% compared to 2019.
This is a screenshot from our most recent webinar episode of SOS Destinations. This episode specifically focused on the summer period (May 2020 to September 2020) where we detected a decrease of 42.4% in online content. However, when examining the whole of 2020 to date, there is a greater decrease in online content – 58.5%.

Fasten Your Seatbelts for these Airline Insights
In regards to flights, the graphic below illustrates a grim outlook for flight reservations over the next 11 months.

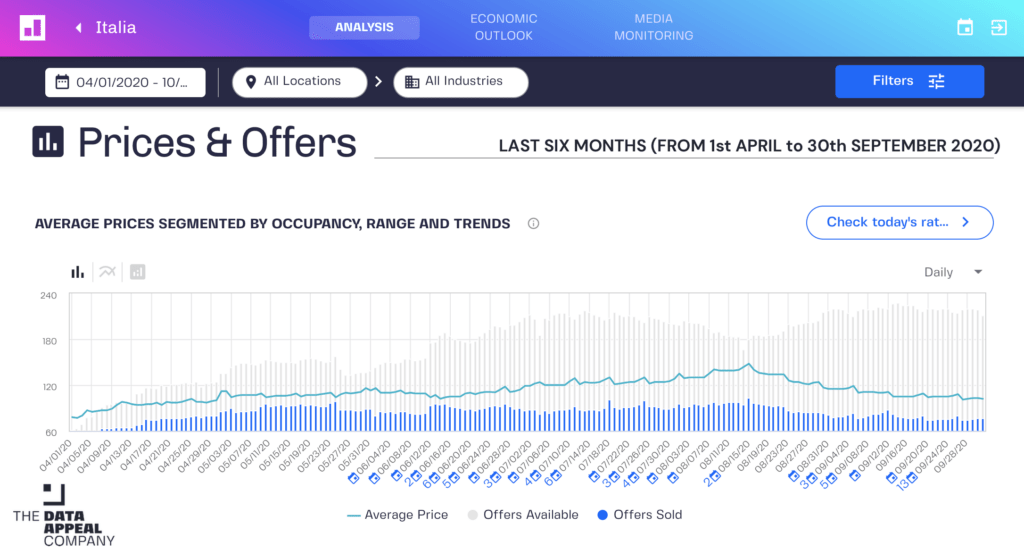
The Economic Outlook for Italian Hospitality
The following screenshot shows price trends and occupancy rates over the past six months. The teal line represents the average prices, while the gray bar illustrates the availability of offers on OTAs. The blue bar highlights the reservations made and offers sold. Some peaks are clearly visible (i.e. Mid-August), but the situation across the time period analyzed reveals a sombering, albeit understandable, trend as Italy was once the epicenter of the Covid-19 crisis.
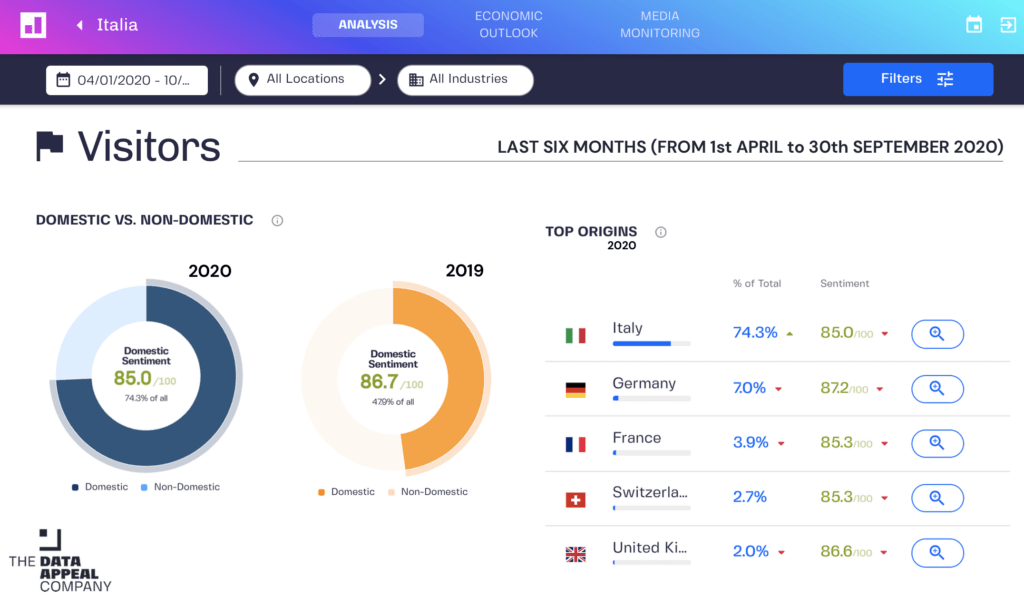
Who’s Who
Italian tourists aren’t overly generous while leaving reviews and the consequential reputational damage is evident.
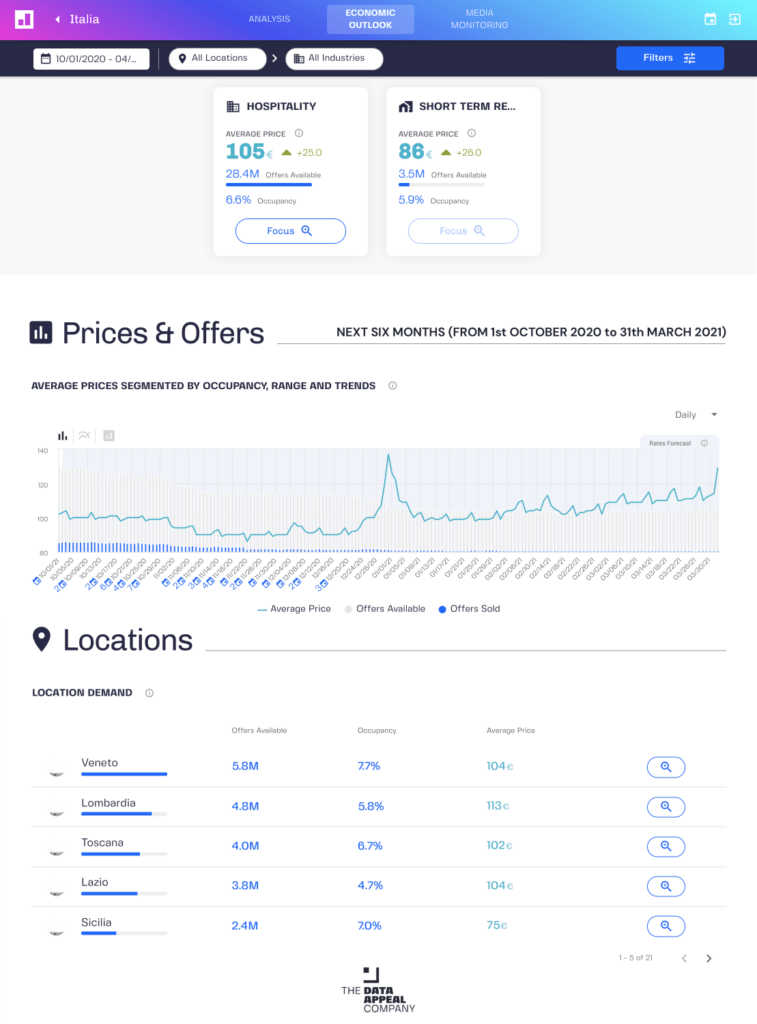
The upcoming months
Lastly, we analyze the trend of our The Covid Safety Index, an indicator that measures how operators and territories are implementing anti-Covid measures and analyzes the perception of visitors and. It detects trust and the perception of safety.
As illustrated below, the CSI score is recovering throughout Italy, with regional rankings that have profoundly changed, also when compared to the previous period. During the summer holidays, the areas most frequented by tourists saw the biggest outbreaks and the Covid Safety Index score for each region reveals as such.

It’s important to note that this data is aggregated across all regions of Italy. In 2020, there have been both destinations full of tourists and destinations with very, very few visitors. This is the obstacle of using averages. However, at the country level, the situation is dramatically clear.