Around the world, Consumer Goods brands are popping up and expanding worldwide.
Yet many Distribution and Market Expansion Managers are asking themselves “where should we distribute our products to reach our target audience and reap the maximum benefits?”
Together with CleverMaps, we explore the importance of Location Intelligence when launching a beverage brand across Stockholm.
Location Intelligence: The most cost-effective strategy for amplifying Consumer Goods Distribution
If you’re currently on the journey to effective market expansion, site selection and distributor qualification, Location Intelligence is by far the ace up your sleeve, especially when looking to save time and money.
For those unfamiliar, Location Intelligence is the methodology of deriving insights from location data like points of interest and ‘places’ data to answer spatial questions, such as:
- Where do I start expanding my brand and how do I best position my products?
- Which venues, distributors and territories should I focus on for site selection?
- Which areas are most frequented by my target audience? What time of day is foot traffic the highest and lowest?
- Which places (bars, restaurants, hotels, etc.) are most appreciated and receive the highest customer sentiment?
- Where should I position outdoor media and advertising for my products?
To define an effective growth strategy for your product expansion, an in-depth analysis of the places and businesses in a selected territory is invaluable.
Combine Location Intelligence with your target personas behaviours and preferences
For growing FMCG (fast moving consumer goods) brands, pinpointing the most strategic places across any city, region or country is critical.
Selecting the right locations for your brand expansion means you will be able to reach the right target personas for your drinks.
Your company could be aiming at young adults having aperitivo every Friday evening after university, or perhaps your brand sells a family-friendly beverage for both parents and children dining together.
Once you determine who you’re reaching, you then need to assess the territory you’re expanding to. With Location Intelligence you’ll uncover:
- Which areas are the most popular for your target personas and at what peak times?
- Which points of sale record the most satisfied customers, or conversely, the most customer complaints?
- What are the main aspects appreciated for each POI by visitors according to the nationality (i.e.Americans like cleanliness, Germans like drink quality, French like price quality, etc.)
- Is your existing reseller base meeting the needs of your customers? What is the level of sentiment of every pub, restaurant and cafe that sells your products?
By deeply understanding the dynamics of a territory, you can identify the areas and venues with the most potential for your drinks and brand.
Penetrating New Markets: The Case of Stockholm, Sweden
To demonstrate in concrete how location intelligence can empower your expansion strategy, we turned to our partners at CleverMaps, a leading Location Intelligence platform enabling businesses to get actionable insights for their decisions through spatial analysis.
We will show you the interactive Location Intelligence map designed by CleverMaps with the POI and territory data provided by Data Appeal, to help an international CPG brand find local activation sites in Stockholm, Sweden.

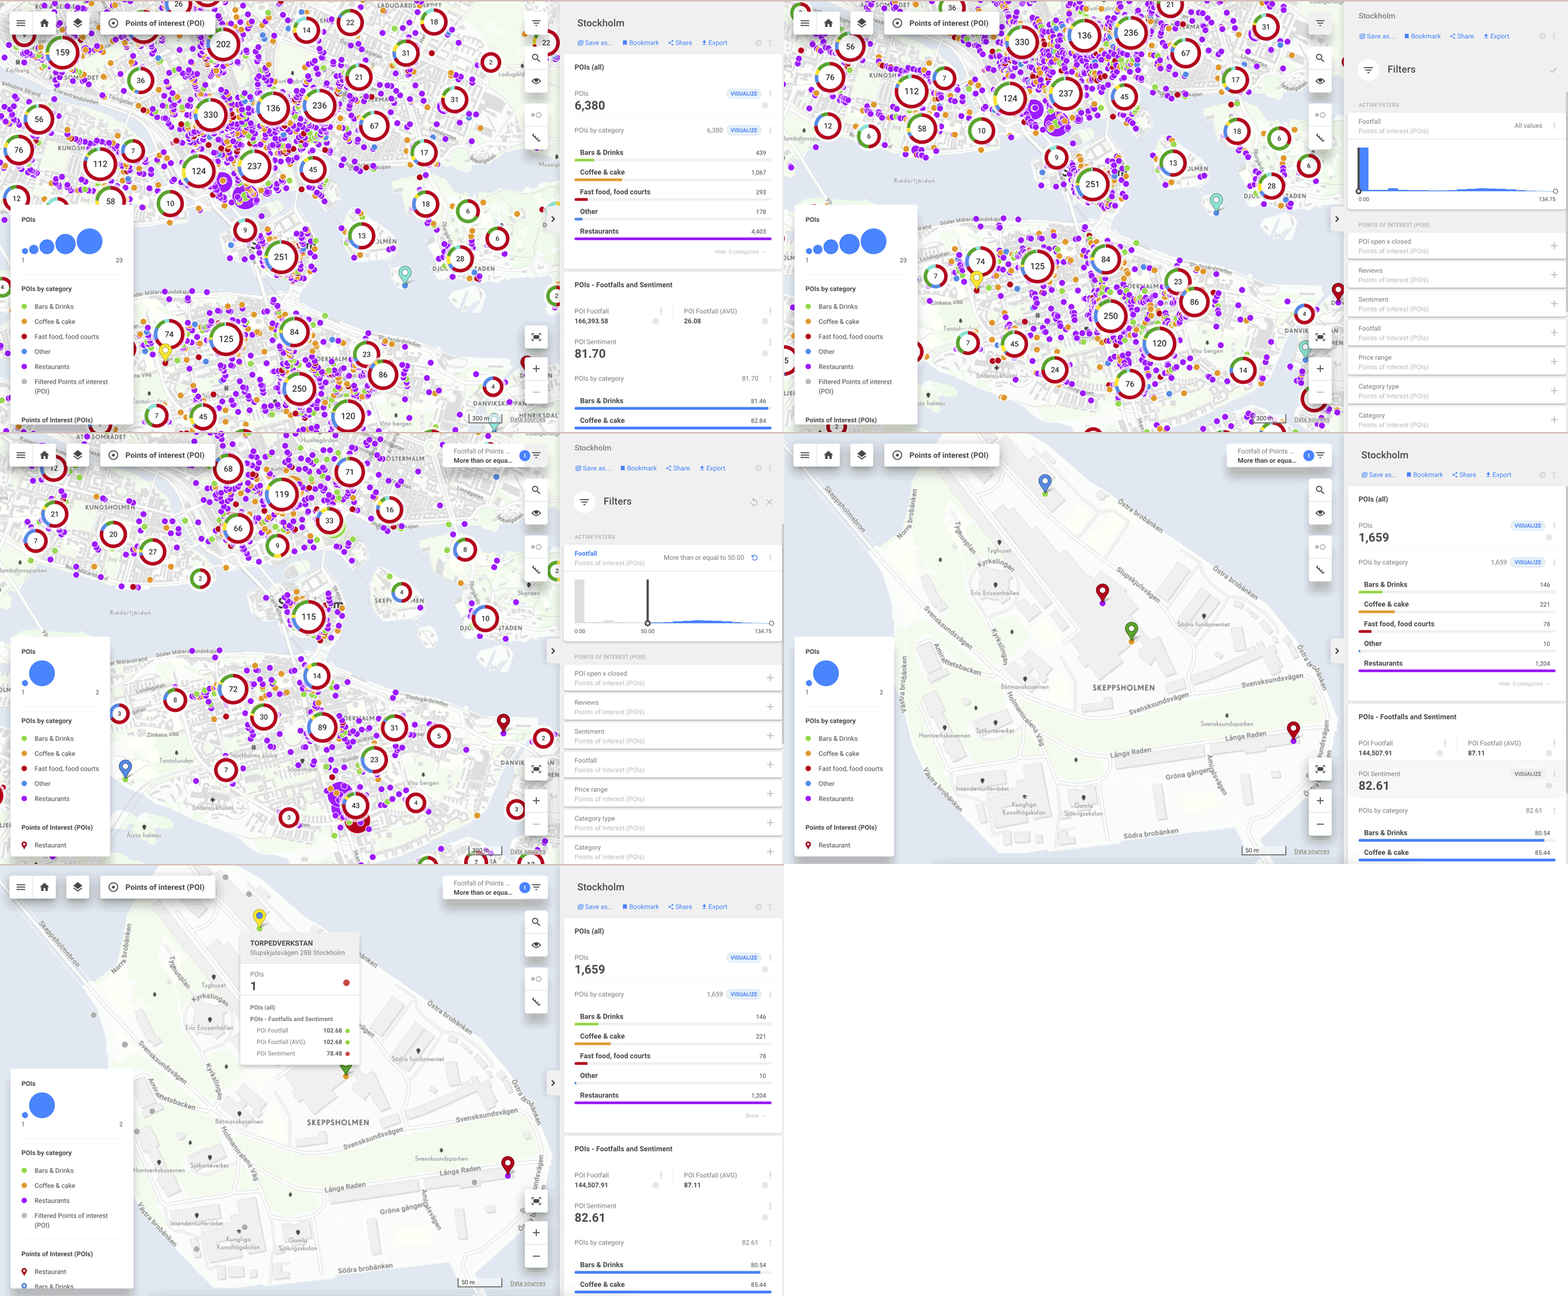
Fig. 1 Showing the total Food & Beverage Points of Interest in Stockholm sorted into categories
The map contains:
- A selection of 6,380 points of interest with quantitative and qualitative information (name, address, contact information, Sentiment Score, Popularity Index, etc.)
- Filters to select POIs by industry, subcategory, Sentiment Score, etc.
- Filters to assess the popularity of neighbourhoods and businesses (popularity heatmap)
- Filters by customer type (couples, solo, families, business, etc)
- Filters the sentiment by language for each POI
- Peak Periods – which time of day is the busiest/slowest for each business
Pinpoint the areas with the highest popularity and identify untapped opportunities
Obviously the central areas of the city are the ones with the highest potential, as the most frequented by locals and tourists.
Having a comprehensive 360° view of the popularity and sentiment all around the city, though, can show you underestimated neighbourhoods in fast growing areas where to invest before your competitors.
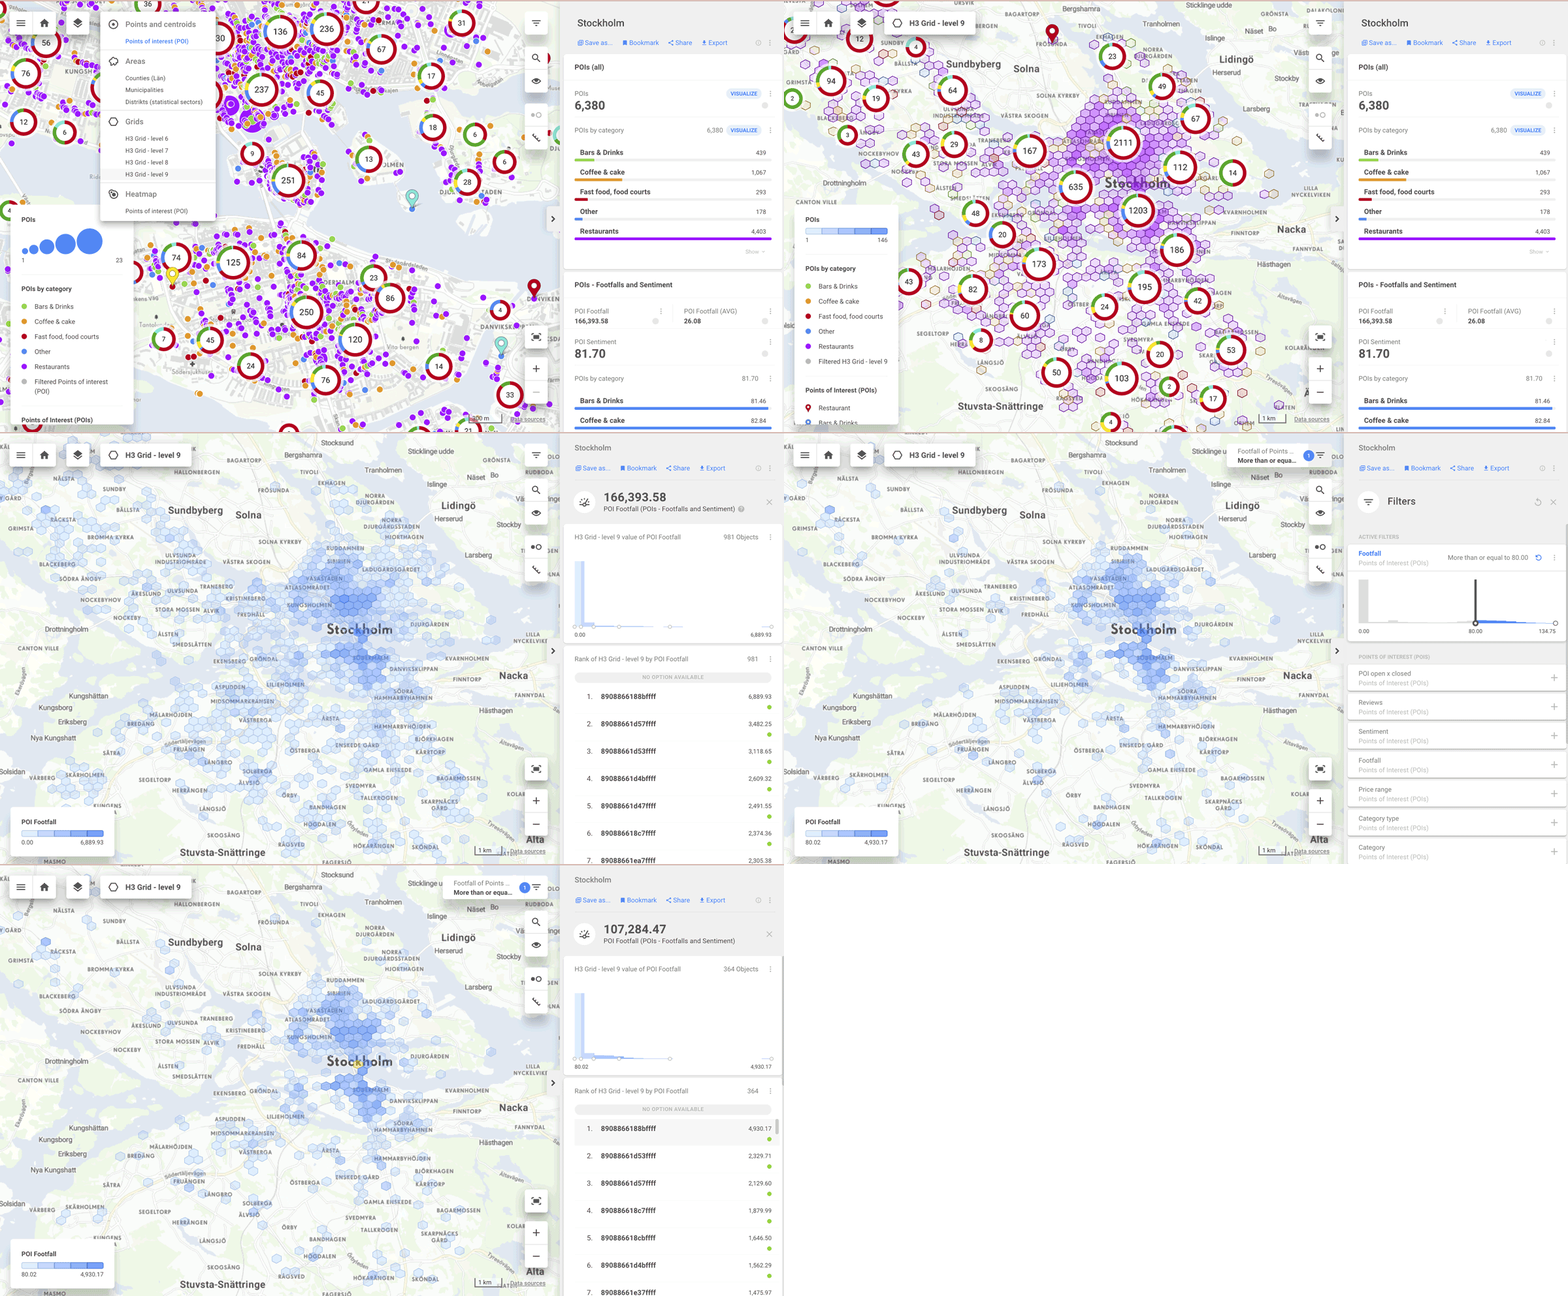
We can visualise a grid with the areas featuring the highest Sentiment Score and Popularity Index, so we filter out anything below 80.
The final visualisation shows us all the grids in Stockholm matching our criteria, and on the dashboard, we have the final rating of the grid available.

Fig. 2 Visualisations of the areas according to the Popularity
This kind of data can be useful also for crafting a more effective marketing strategy: pinpointing the most frequented areas around the most popular restaurants, pubs, gyms or supermarkets can be a good starting point for defining outdoor advertising and out-of-home marketing campaigns and events.
Select the top-rated and most popular places to position your products
By dividing points of interest into industries and subcategories, you can easily filter them based on your preference.
In this case, we are focusing on the on-trade distribution strategy so only the Food & Beverage category (bars, pubs, cafes, and restaurants) is included in this demo project. If you are looking to develop your off-trade strategy as well, it is possible to add more categories, such as supermarkets and grocery stores to your project.
In order to make your drinks distributed in highly renowned places in the new market, you must focus your efforts in identifying the POI with the highest sentiment and the highest popularity, which is to say the ones most appreciated on online reviews and most frequented by people.
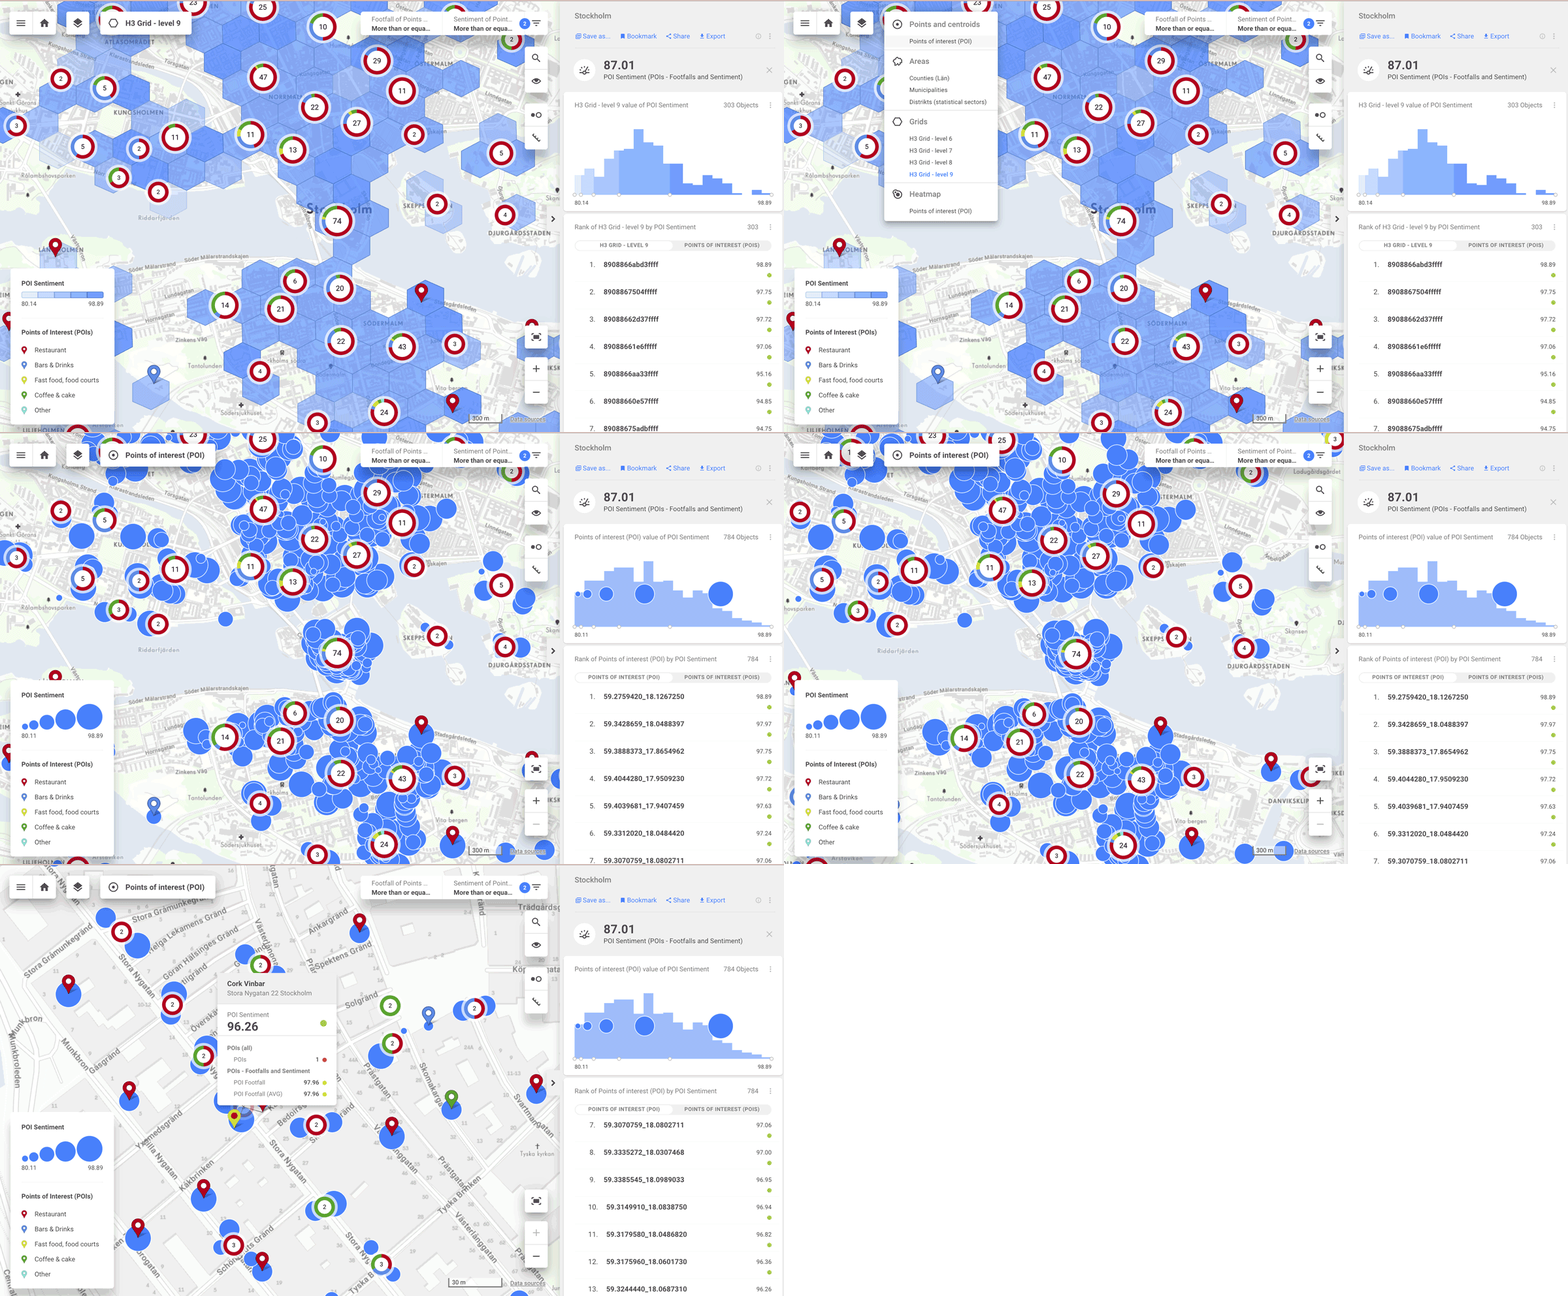
As a result, we visualise all the selected POIs on a dot map that also reflects the related Sentiment Score and Popularity Index – the bigger the dot, the higher values of both.

Fig. 3 Filtering the relevant points of interest in the CleverMaps platform
This kind of analysis is very useful also to define top-rated places to organise promotional events to make your target audience taste your drinks for the first time.
According to our POI data analysis, these are some of the best venues in town, featuring more than 100 reviews online and a Sentiment score over 90:
- Corkvinbar: Sentiment Score 96/100 – Popularity index 79
- Cafefika: Sentiment Score 95/100 – Popularity index 83
- Stockholms Gästabud: Sentiment Score 94.8/100 – Popularity Index 104
Segment venues by type: Pubs, bars, restaurants & liquor stores
To support your strategy according to your desired positioning, you can also filter the POIs by detailed categories, such as:
- Pubs and Gastropubs
- Cafes
- Bars
- Restaurants
- Pizzerias
- Ice-cream shops and
- Confectioneries
- Bakeries
- Bistros
- Wine-stores
- Catering services
- Kiosks
- Juice shops
- Donut shops
If you are selling high-quality drinks and spirits, you may want to find the most popular restaurants, bars, luxury liquor stores, and maybe hotels featuring a bar or a restaurant.
On the other hand, if you are planning the expansion of a beer or soft drink brand, you will focus on bars, cafes and restaurants.
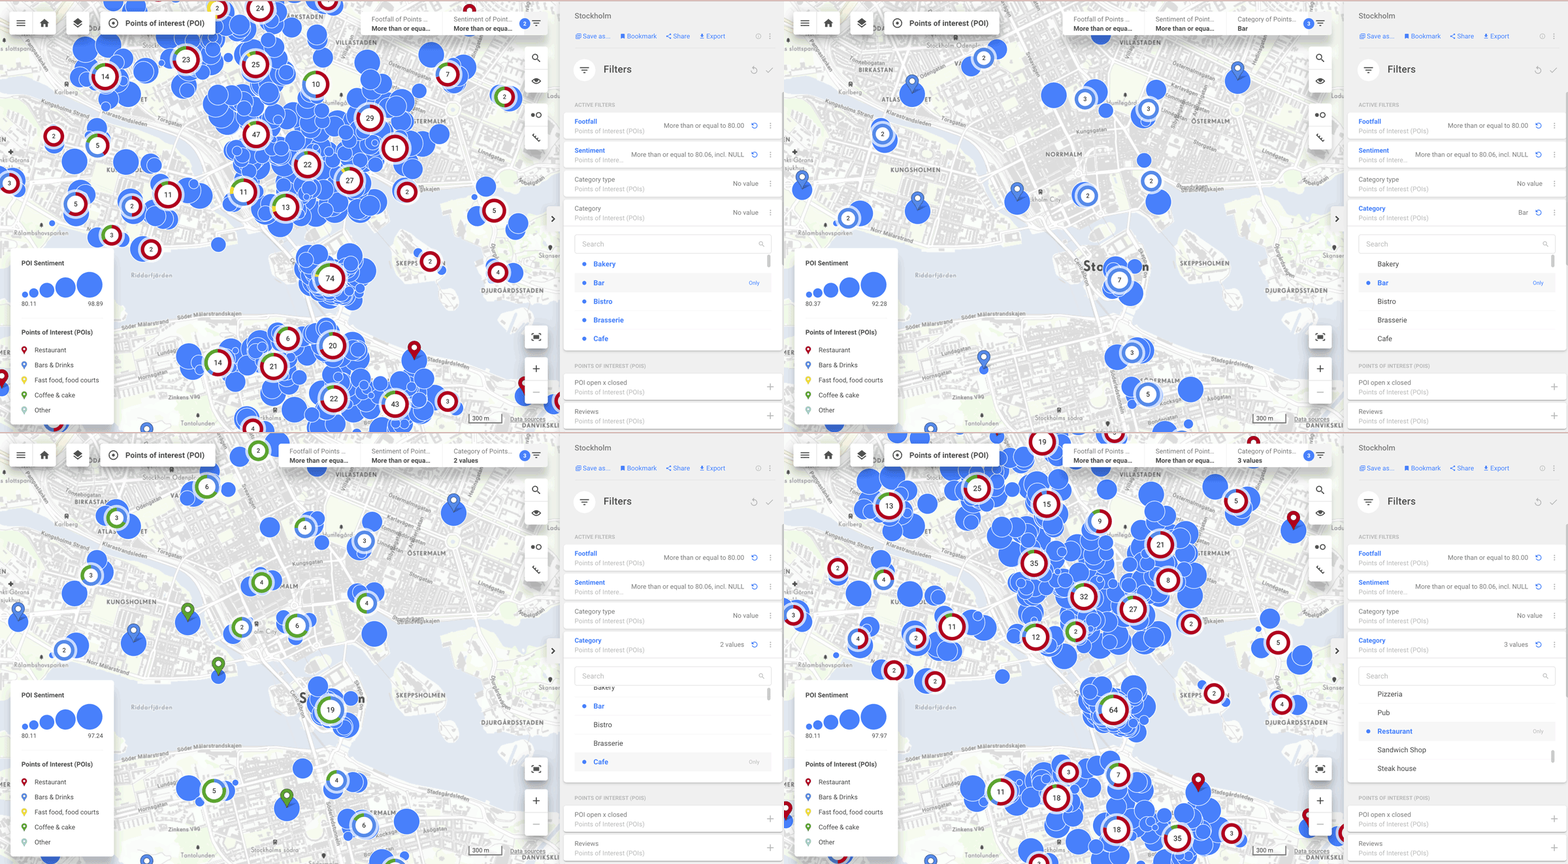
In the following CleverMaps’ map, we are visualising only restaurants with sentiment over 80.

Fig. 4 Filtering bars, cafes and restaurants with a sentiment over 80
Making Smarter Decisions with POI Data Analysis
After conducting this analysis, a FMCG brand related to the food and beverage can use this kind of points of interest data to:
- Qualify distributors and resellers effortlessly by accessing POI address and contacts, so the sales team have all the information at fingertips to contact and meet prospects
- Comparing current product coverage against competitors
- Pinpointing optimal areas for outdoor advertising and out-of-home marketing campaigns and events
- Identify best venues for promotional events or roadshow
Unlike static data and one-time results offered by standard data analysis, Location Intelligence and real-time data provide dynamic and constantly updated analyses and forecasts.
Interactive maps such as the ones provided by CleverMaps enhance the data by providing users with actionable insights to inspire new ideas and reveal new investment and positioning opportunities.


