This index measures the effect that climate in a tourist destination has on visitor satisfaction during their stay.
Good weather or bad weather? It depends. How climate impacts our level of satisfaction towards a destination when we travel depends on what our expectations were prior to the trip. That’s why it is so important to work with Travel Intelligence tools that understand how this external factor can affect visitor experience and satisfaction. A destination is unable to change its climate (well… in any case it is unable to improve it although we all know that climate is changing for the worse) but what it can change is everything that is related to the tourist offering and how it is affected by climate: communication, seasonality, infrastructure, target markets, etc. Mabrian Technologies has developed a methodology to measure this.

How is this Index calculated?
The index is calculated by using advanced Natural Language Processing, Artificial Intelligence and Machine Learning techniques to analyse millions of spontaneous tourist interactions on Social Media in real time. It enables the identification of tourist mentions related to climate and the sentiment associated to it, in order to understand when a destination suffers variations in the perception of climate.
This process is carried out in a totally anonymised way although Mabrian’s capacity to segment this analysis into different origin markets, including origin regions, allows for a comparison of how sensitive each market is when faced with the same climate at destination.
This index does not seek to measure whether it is good or bad weather at the destination, as that is related to visitor expectation, but rather to measure if the climate reality in the destination at a given point meets visitor expectations and to what extent.
A good example is that the Perception of Climate index for visitors to London will most likely remain high despite it raining the whole time because this is somewhat expected and therefore visitors are not disappointed by this.
How valuable is this information?
Throughout the summer of 2022, we have seen how temperatures have soared and beaten heat wave records even affecting places such as the north of Europe thus making this Index ever more relevant.
Will traditional tourism trends in the medium run be affected by global warming? Will tourists no longer have to travel as far South when it comes to the largest holiday source markets such as United Kingdom, Germany or the Nordic countries?
Should hotel chains start focusing on milder destinations for new hotel openings?
Here are a few of the ways that this indicator can help us to make better data-driven decisions:
- Analyse and compare a destination’s climate perception in real time. In general and specifically related to concrete events: heat waves, rain or snowstorms, hurricanes, etc.
- Identify markets that are less sensitive to climate.
- Segment and adapt the communication and messages for each of the markets.
- Measure the impact of climate perception related to the overall visitor satisfaction.
- Anticipate fluctuations in demand related to climate alterations.
These are just a few ideas of how to directly apply the knowledge gained, to illustrate the potential that having access to this information can offer for decision making whether strategic or operational, marketing related, revenue management related or when managing a destination, investments, etc.
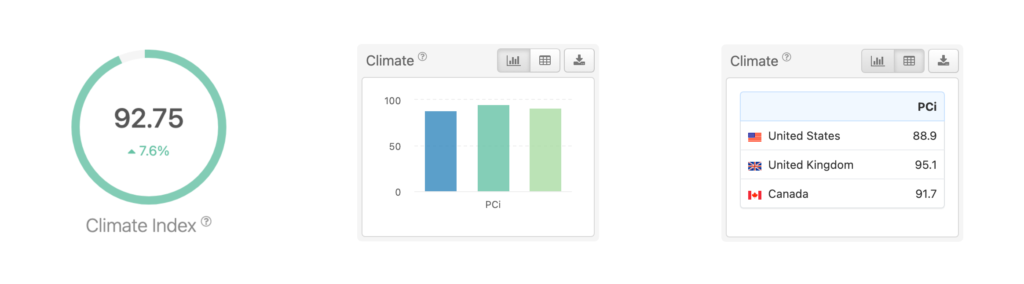
How is this index presented?
This index, as well as many other perception and tourism evolution indices calculated by Mabrian can be found in Mabrian’s cloud-based Travel Intelligence platform. This interactive platform can be easily accessed at any time for a given destination. With a scale of 100-0, the Perception of Climate Index shows an up-to-date view of the situation for the selected period, including the YOY variation.
Do you want to find out more?
Here are some examples of how the index was applied to help you see its potential.
Best value-for-money European tourist destinations