
A destination can do everything right—build its brand, attract attention, generate genuine desire in an origin market—and still lose the visitor to somewhere else. Not because its beaches are worse or its hotels more expensive, but because getting there is harder.
Travellers rarely choose a destination in isolation. They weigh appeal against practicality: are there direct flights? Are they affordable? Do the schedules work? When the answer is no, interest doesn’t disappear. It often redirects.
That is the gap air connectivity data is designed to close.
When a source market is poorly connected, when a destination loses key routes, or when a crisis disrupts travel patterns, the impact is felt long before visitors arrive.
That is why air connectivity data matters: it helps destinations understand not only who wants to travel, but who can realistically get there—and how changes in access may affect future demand.
For destination managers, tourism boards, airports, and travel brands, air connectivity is more than an operational detail.
It is an early indicator of market opportunity, demand pressure, vulnerability, and recovery potential.
A destination may be generating strong interest in a particular market, but if flight capacity is limited, routes are reduced, prices rise, or connections become more complicated, that interest may not translate into arrivals.
This is where air connectivity data becomes a strategic layer of tourism intelligence.

What air connectivity data reveals
Air connectivity data explains how a destination is linked to its key origin markets by air, and how that access changes over time.
It shows the scheduled supply of air travel to the destination: the number of seats and flights available, the airports and airlines providing them, the type of routes involved, and the days on which arrivals are scheduled. It can also show whether capacity is increasing, decreasing, or shifting between markets, airlines, or seasons.
This helps explain whether travellers from a given market have more or fewer opportunities to reach the destination, and whether future demand may be supported or limited by available air access.
Air connectivity data is therefore not simply a list of flights. It is a powerful forecasting tool because it reflects global travel intent: high-frequency direct routes to specific destinations signal strong demand for leisure and business travel, while also revealing the structure, strength, and evolution of a destination’s air access, and its potential impact on competitiveness.
Why air connectivity data matters
Air access matters because it can shape whether travel demand turns into actual visitation.
A destination may generate strong interest in an origin market, but that interest is easier to convert when travellers have available routes, sufficient seat capacity, and flight schedules that make the trip practical.
This makes air connectivity important for several reasons:
- Growth potential: More seats, new routes, or higher frequencies can give a destination more room to grow from a specific market. When access improves, travellers have more opportunities to choose the destination, and tourism businesses may benefit from a larger pool of potential visitors.
- Market constraints: Reduced routes, fewer flights, or more seasonal service can limit how much demand a destination is able to capture. Even when traveller interest exists, weaker connectivity can make the destination harder to reach or less convenient compared with alternatives.
- Destination competitiveness: Travellers often compare destinations not only by appeal, but also by how practical the journey feels. If another destination offers more direct routes, better timing, or greater availability, it may have an advantage.
- Performance context: Changes in arrivals should not be read only as changes in traveller interest, marketing impact, or destination image. They may also reflect changes in air access from key origin markets.
- Forward planning: Because scheduled capacity is visible before travel takes place, air connectivity data can help destinations spot potential opportunities or risks earlier. This allows teams to prepare for growth, monitor vulnerable markets, or adjust activity before changes are fully reflected in arrivals.

Examples: disruption, vulnerability, growth and resilience
Air connectivity data looks different depending on the situation. Here are four examples that show how changes in air access can reveal distinct challenges and opportunities for destinations.
Disruption: air access can change quickly
External events can reshape air access almost immediately, especially when they affect airspace, airline operations, or traveller confidence.
Following the onset of the Iran conflict in early 2026, analysis of air connectivity between the Americas and the Middle East showed a sharp decline in scheduled seat capacity, with availability from 14 U.S. airports to Middle Eastern destinations falling by 59.1%. Routes from Brazil also saw reductions, while Mexico experienced a more limited impact.
For destinations, this type of insight is important because disruption does not affect every market in the same way. Some routes, corridors, or origin markets may become exposed more quickly than others, changing the conditions for travel before the full impact appears in visitor arrivals.
Vulnerability: capacity losses are not evenly distributed
A change in airline strategy can reveal how dependent some markets are on specific carriers, routes, or travel segments.
The example of Spirit Airlines’ exit from the U.S. market shows this clearly: the analysis estimated that 21.3 million seats would be affected through the end of 2026, with most of the impacted capacity linked to domestic routes and the low-cost segment.
The significance is not only the total number of seats removed. It is also where those seats were concentrated. When a destination or airport relies heavily on one airline or one type of service, a network change can create access gaps that may affect future performance.
Read more: Spirit Airlines’ Exit Affects U.S. Air Connectivity Network Through the End of 2026
Growth: connectivity can support long-term strategy
Air connectivity can also help destinations look beyond short-term performance and understand where future growth may come from.
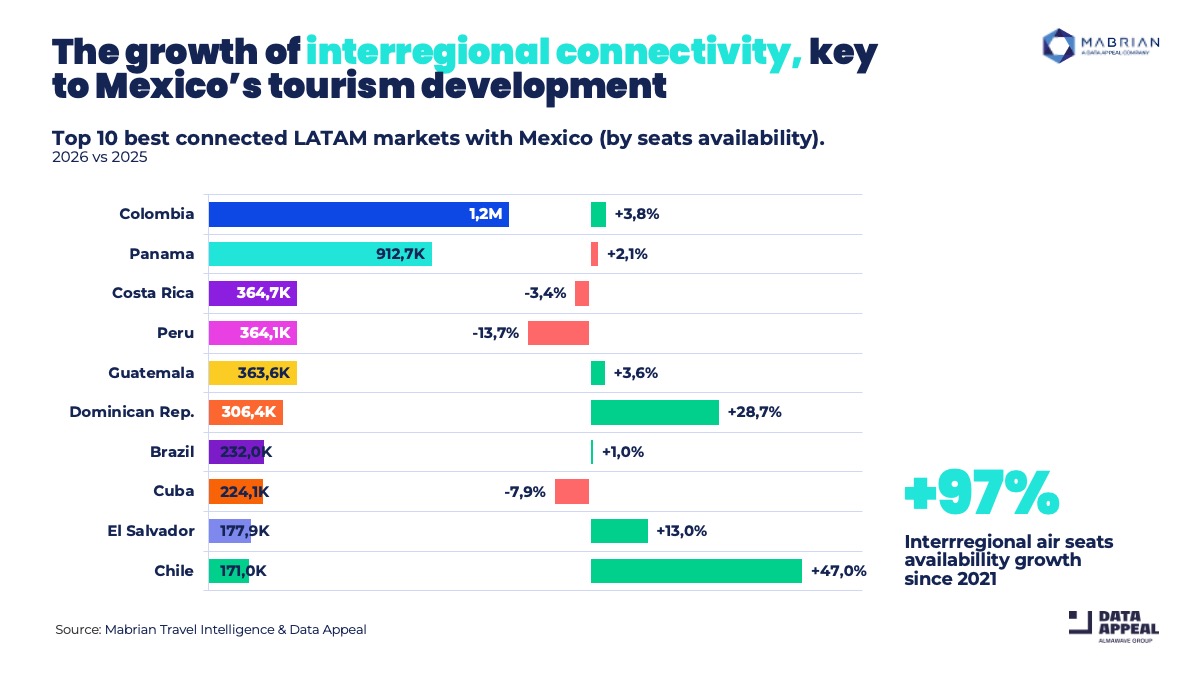
For instance, Mexico’s connections with other LATAM markets show how regional travel can become a stronger source of tourism growth. According to Mabrian’s Mexico Horizon 2030 analysis, interregional air seat availability has grown 97% since 2021.
In 2026, Colombia is expected to be Mexico’s best-connected LATAM market, with 1.2 million seats, followed by Panama with 912,700 seats. Other regional markets are also gaining momentum, including the Dominican Republic (+28.7%), El Salvador (+13%) and Chile (+47%).
This kind of insight helps destinations identify which origin markets are becoming more relevant, where regional demand is strengthening, and how improved connectivity can support a more diversified tourism model.
Read more: Connectivity, community and high-value tourism to underpin Mexico’s tourism towards 2030
Resilience: connectivity can reveal strength as well as risk
Air connectivity data can also show where destinations or regions are holding up despite uncertainty.
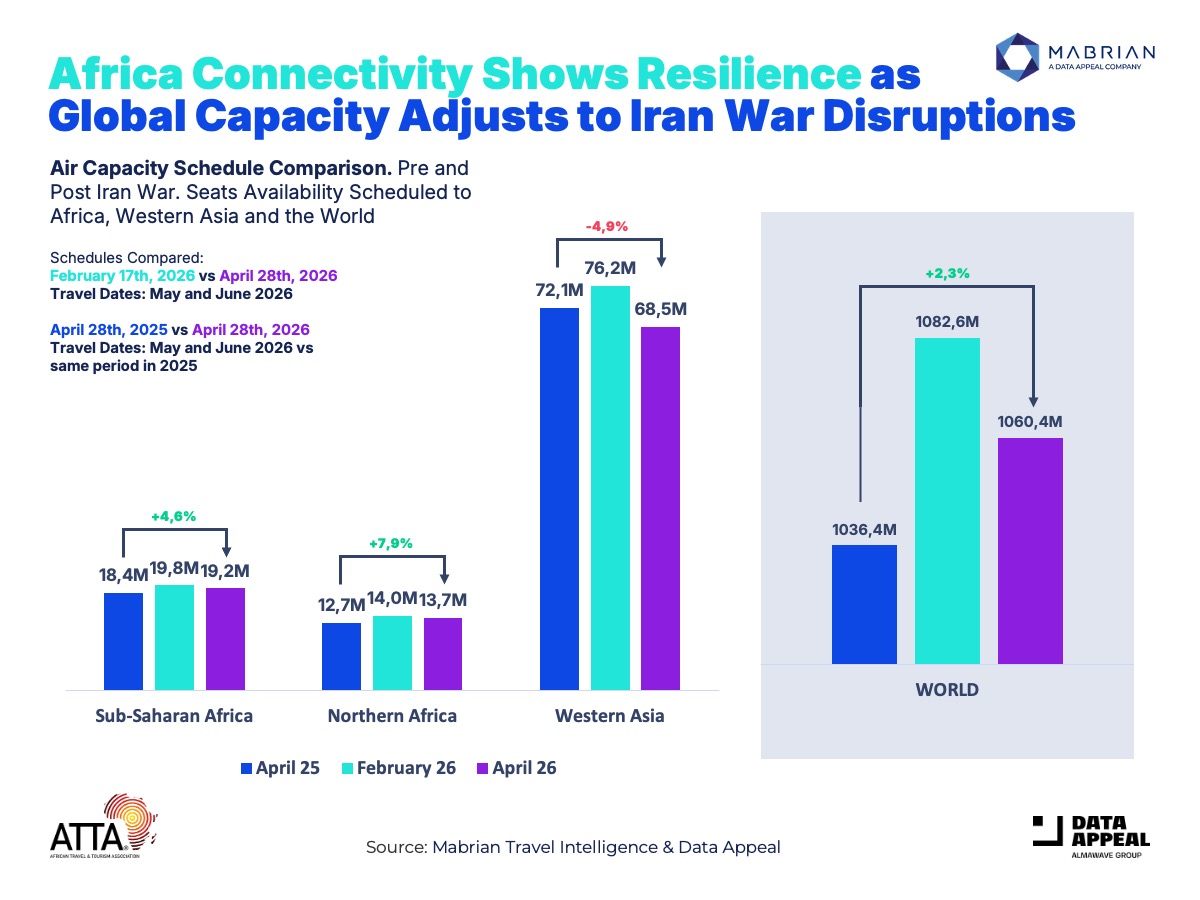
An ATTA® analysis of air travel to Africa, in partnership with Data Appeal and Mabrian, found that air capacity to the continent continued to grow year on year despite global disruption, with both North Africa and Sub-Saharan Africa recording year-on-year growth for May and June 2026 travel. More than 89 million inbound seats were scheduled to Africa across 2026 as a whole.
This adds another important perspective: connectivity data is not only about identifying pressure points. It can also highlight where airline confidence remains strong, where access is expanding, and where a region may be gaining momentum while other markets face disruption.
Read more: Air Travel to Africa Growing Despite Global Disruption
What air connectivity data is useful to compare with
Air connectivity data is most valuable when it is read alongside other indicators. On its own, it shows how air access is structured and how scheduled capacity is changing.
When combined with demand, booking, traffic, accommodation, spend, perception, mobility, and sustainability data, it can help explain how air access connects to wider destination performance.
Useful comparisons include:
- Flight prices: Average one-way flight prices from different origins can add context to changes in air access. They help show how prices are evolving by country or origin airport, and how price trends compare with available capacity.
- Search demand: Travel searches can show whether interest in a destination is growing in line with available air access, or whether demand is rising in markets where capacity remains limited.
- Bookings and reservations: Confirmed reservations help show whether available seats are translating into actual travel commitments.
- Passenger traffic: Incoming passenger estimates can indicate whether scheduled air access is reflected in broader passenger movement to the destination.
Beyond aviation data, other tourism datasets can add further context:
- Accommodation demand and prices: Hotel and vacation rental data can show whether increased connectivity is supporting overnight stays, affecting prices, or changing stay patterns.
- Visitor presence and mobility: Data on visitor presence, length of stay, origin markets, and movement within the destination can show how air access translates into behaviour on the ground.
- Visitor spend: Spending data by origin market and category can help destinations understand whether changes in connectivity are bringing economic value, not only visitor volume.
- Traveller perception and satisfaction: Sentiment, satisfaction, and perception data can help explain whether air access is supported by a positive destination image and visitor experience.
- Sustainability indicators: Measures such as seasonality, dependence on origin markets, carbon footprint, and distribution of tourism income can show the wider impact of connectivity on long-term destination balance.
In short, air connectivity data shows whether travellers can reach a destination and if there is growing intent from an incoming market; the related indicators show whether that access is matched by interest, bookings, passenger movement, stays, spending, satisfaction, and sustainable value.

From signal to strategy: how the data works together
It starts with a signal. Scheduled seat capacity to a key origin market is falling, or a new route has just been announced. On its own, that’s just a number. The question is what it means.
The next layer—flight prices, search volumes, confirmed bookings—starts to give it context. Are travellers from that market still searching? Are searches converting into reservations, or stalling? Is the price trend making the destination more or less competitive? Each answer either amplifies the signal or complicates it.
Then the wider picture comes in.
Accommodation data can show whether air access is actually translating into overnight stays.
Mobility data can reveal where visitors go once they arrive.
Spend data can show whether connectivity is generating real economic value.
Sentiment data can indicate whether the destination experience is strong enough to sustain demand even when access tightens.
Sustainability indicators can help assess whether growth is balanced or creating pressure.
That shift from reporting the past to shaping the future is what turns connectivity data from a monitoring tool into a strategic one. In practice, it means destinations can:
- Prioritise markets where air access, demand, bookings, and value are aligned.
- Monitor at-risk markets where interest exists but capacity is weakening or bookings are not converting.
- Time campaigns around periods when future capacity is available and demand can be captured.
- Support airline and airport conversations with evidence on origin-market demand, capacity gaps, and growth potential.
- Prepare local partners by sharing signals with hotels, attractions, transport providers, and tourism businesses.
- Plan for balanced growth by considering not only visitor volume, but also spend, mobility, seasonality, and sustainability impacts.
Together, these steps help destinations move from asking “What changed?” to “Why does it matter?” and finally “What should we do next?”
Data Appeal Mabrian’s Air Connectivity Module
Data Appeal Mabrian’s Air Connectivity Module gives destinations a broader view of air access and air travel demand. It shows how many seats or flights are scheduled but also helps explain how that access connects with traveller interest, bookings, prices, and expected passenger movement.
The module is built around five main areas:
- Air Capacity Analysis: Scheduled seats and flights, direct connectivity, origin airports, airlines, arrival days, regular vs non-regular airlines, capacity evolution, alerts for schedule changes, and schedules up to 12 months ahead.
- Flight Price Analysis: Average one-way flight prices from different origins, including advance booking periods from 1 to 6 months, price evolution by country and origin airport, and capacity vs price analysis.
- Search Analysis: Flight search activity to a destination, including year-on-year search evolution, search share by origin, search and travel days, origin airports, average searched stay, and advance search days.
- Effective Reservation Analysis: Confirmed effective reservations through GDS/MIDT data, including effective passengers by country and origin airport, reservation evolution, stopovers, average stay, booking lead time, travel class, and people per reservation.
- Total Traffic Estimate: Estimated total incoming passenger volume for the destination airport, including GDS data and direct airline bookings such as low-cost carriers, with breakdown by origin country.
Together, these indicators help destinations move beyond a basic view of connectivity. They can see not only whether air access is increasing or decreasing, but also whether that access is matched by demand, whether searches are turning into bookings, how prices are evolving, and how passenger volumes are likely to develop.
This gives destination teams a more complete picture of the air travel environment around them, allowing them to connect all the different signals and better understand how air access is influencing destination performance.


Data Appeal Mabrian Air Connectivity Module
Interested in learning more?
Reach out to our team